Immigrants from Dominican Republic vs Immigrants from Central America Unemployment Among Ages 60 to 64 years
COMPARE
Immigrants from Dominican Republic
Immigrants from Central America
Unemployment Among Ages 60 to 64 years
Unemployment Among Ages 60 to 64 years Comparison
Immigrants from Dominican Republic
Immigrants from Central America
6.0%
UNEMPLOYMENT AMONG AGES 60 TO 64 YEARS
0.0/ 100
METRIC RATING
333rd/ 347
METRIC RANK
5.4%
UNEMPLOYMENT AMONG AGES 60 TO 64 YEARS
0.0/ 100
METRIC RATING
298th/ 347
METRIC RANK
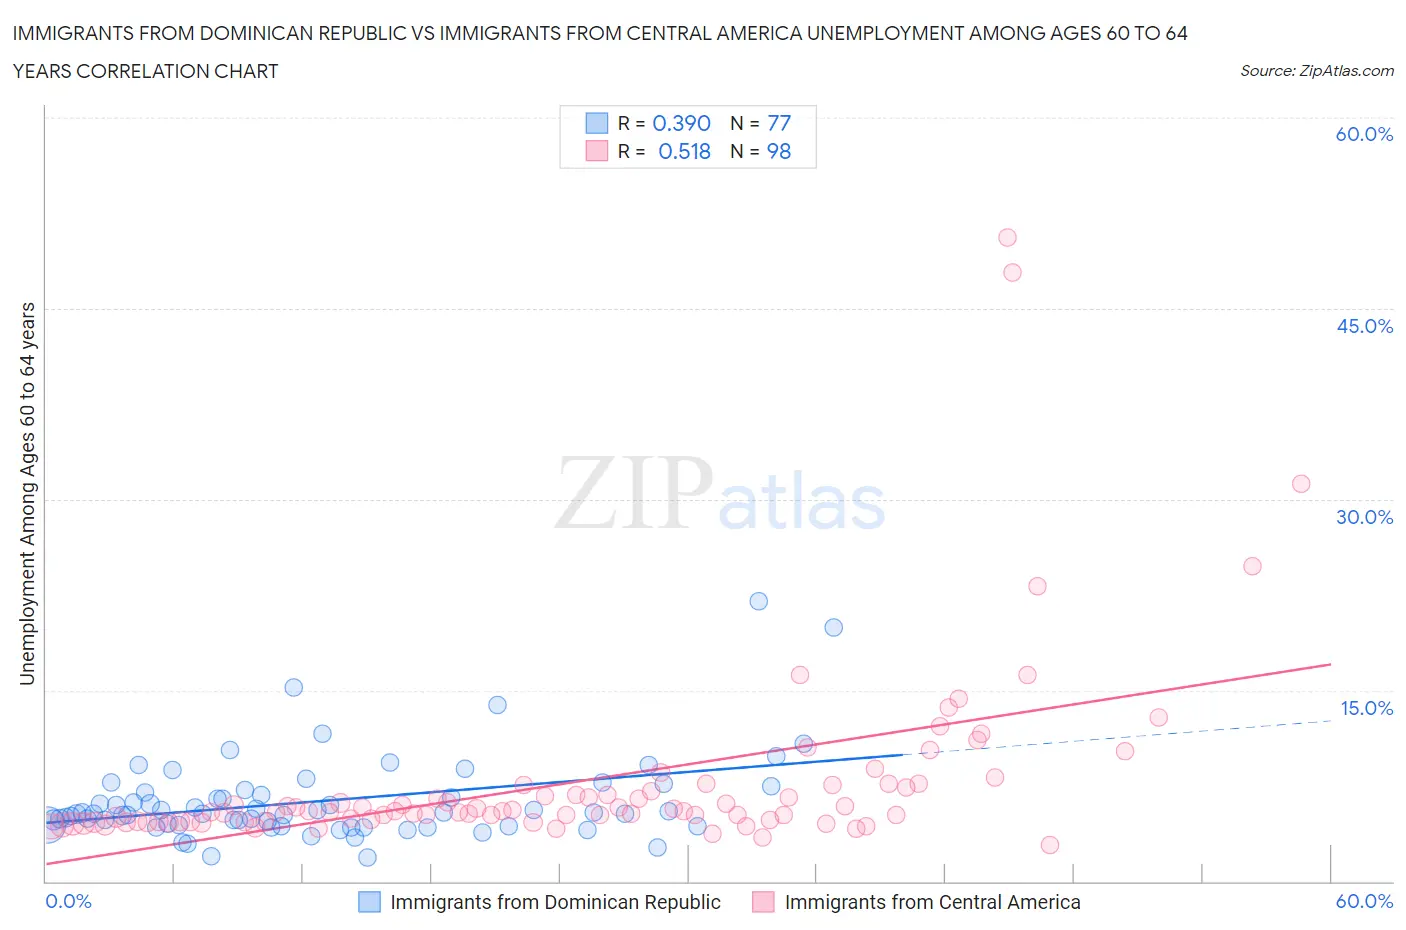
Immigrants from Dominican Republic vs Immigrants from Central America Unemployment Among Ages 60 to 64 years Correlation Chart
The statistical analysis conducted on geographies consisting of 256,183,735 people shows a mild positive correlation between the proportion of Immigrants from Dominican Republic and unemployment rate among population between the ages 60 and 64 in the United States with a correlation coefficient (R) of 0.390 and weighted average of 6.0%. Similarly, the statistical analysis conducted on geographies consisting of 450,671,068 people shows a substantial positive correlation between the proportion of Immigrants from Central America and unemployment rate among population between the ages 60 and 64 in the United States with a correlation coefficient (R) of 0.518 and weighted average of 5.4%, a difference of 11.9%.
Unemployment Among Ages 60 to 64 years Correlation Summary
| Measurement | Immigrants from Dominican Republic | Immigrants from Central America |
| Minimum | 1.9% | 2.9% |
| Maximum | 22.0% | 50.6% |
| Range | 20.1% | 47.7% |
| Mean | 6.3% | 7.8% |
| Median | 5.3% | 5.5% |
| Interquartile 25% (IQ1) | 4.4% | 4.7% |
| Interquartile 75% (IQ3) | 7.1% | 7.3% |
| Interquartile Range (IQR) | 2.7% | 2.6% |
| Standard Deviation (Sample) | 3.4% | 7.4% |
| Standard Deviation (Population) | 3.4% | 7.4% |
Similar Demographics by Unemployment Among Ages 60 to 64 years
Demographics Similar to Immigrants from Dominican Republic by Unemployment Among Ages 60 to 64 years
In terms of unemployment among ages 60 to 64 years, the demographic groups most similar to Immigrants from Dominican Republic are Dominican (6.0%, a difference of 0.35%), Yakama (6.0%, a difference of 0.37%), Immigrants from Armenia (6.0%, a difference of 0.51%), Immigrants from Bangladesh (6.0%, a difference of 0.77%), and Apache (6.0%, a difference of 0.78%).
| Demographics | Rating | Rank | Unemployment Among Ages 60 to 64 years |
| Immigrants | St. Vincent and the Grenadines | 0.0 /100 | #326 | Tragic 5.9% |
| Immigrants | Grenada | 0.0 /100 | #327 | Tragic 5.9% |
| Apache | 0.0 /100 | #328 | Tragic 6.0% |
| Immigrants | Bangladesh | 0.0 /100 | #329 | Tragic 6.0% |
| Immigrants | Armenia | 0.0 /100 | #330 | Tragic 6.0% |
| Yakama | 0.0 /100 | #331 | Tragic 6.0% |
| Dominicans | 0.0 /100 | #332 | Tragic 6.0% |
| Immigrants | Dominican Republic | 0.0 /100 | #333 | Tragic 6.0% |
| Puerto Ricans | 0.0 /100 | #334 | Tragic 6.1% |
| Vietnamese | 0.0 /100 | #335 | Tragic 6.1% |
| Kiowa | 0.0 /100 | #336 | Tragic 6.2% |
| Navajo | 0.0 /100 | #337 | Tragic 6.3% |
| Arapaho | 0.0 /100 | #338 | Tragic 6.3% |
| Tlingit-Haida | 0.0 /100 | #339 | Tragic 6.4% |
| Pueblo | 0.0 /100 | #340 | Tragic 6.7% |
Demographics Similar to Immigrants from Central America by Unemployment Among Ages 60 to 64 years
In terms of unemployment among ages 60 to 64 years, the demographic groups most similar to Immigrants from Central America are Osage (5.4%, a difference of 0.050%), Immigrants from El Salvador (5.4%, a difference of 0.050%), Immigrants from Barbados (5.4%, a difference of 0.080%), Immigrants from Jamaica (5.4%, a difference of 0.10%), and Barbadian (5.4%, a difference of 0.50%).
| Demographics | Rating | Rank | Unemployment Among Ages 60 to 64 years |
| Hispanics or Latinos | 0.0 /100 | #291 | Tragic 5.3% |
| Immigrants | Latin America | 0.0 /100 | #292 | Tragic 5.3% |
| Immigrants | Israel | 0.0 /100 | #293 | Tragic 5.3% |
| Blacks/African Americans | 0.0 /100 | #294 | Tragic 5.3% |
| Armenians | 0.0 /100 | #295 | Tragic 5.3% |
| Jamaicans | 0.0 /100 | #296 | Tragic 5.3% |
| Osage | 0.0 /100 | #297 | Tragic 5.4% |
| Immigrants | Central America | 0.0 /100 | #298 | Tragic 5.4% |
| Immigrants | El Salvador | 0.0 /100 | #299 | Tragic 5.4% |
| Immigrants | Barbados | 0.0 /100 | #300 | Tragic 5.4% |
| Immigrants | Jamaica | 0.0 /100 | #301 | Tragic 5.4% |
| Barbadians | 0.0 /100 | #302 | Tragic 5.4% |
| Bahamians | 0.0 /100 | #303 | Tragic 5.4% |
| Immigrants | Mexico | 0.0 /100 | #304 | Tragic 5.4% |
| Cypriots | 0.0 /100 | #305 | Tragic 5.4% |