Immigrants from Czechoslovakia vs Immigrants from Spain Median Earnings
COMPARE
Immigrants from Czechoslovakia
Immigrants from Spain
Median Earnings
Median Earnings Comparison
Immigrants from Czechoslovakia
Immigrants from Spain
$52,361
MEDIAN EARNINGS
100.0/ 100
METRIC RATING
45th/ 347
METRIC RANK
$51,092
MEDIAN EARNINGS
99.9/ 100
METRIC RATING
67th/ 347
METRIC RANK
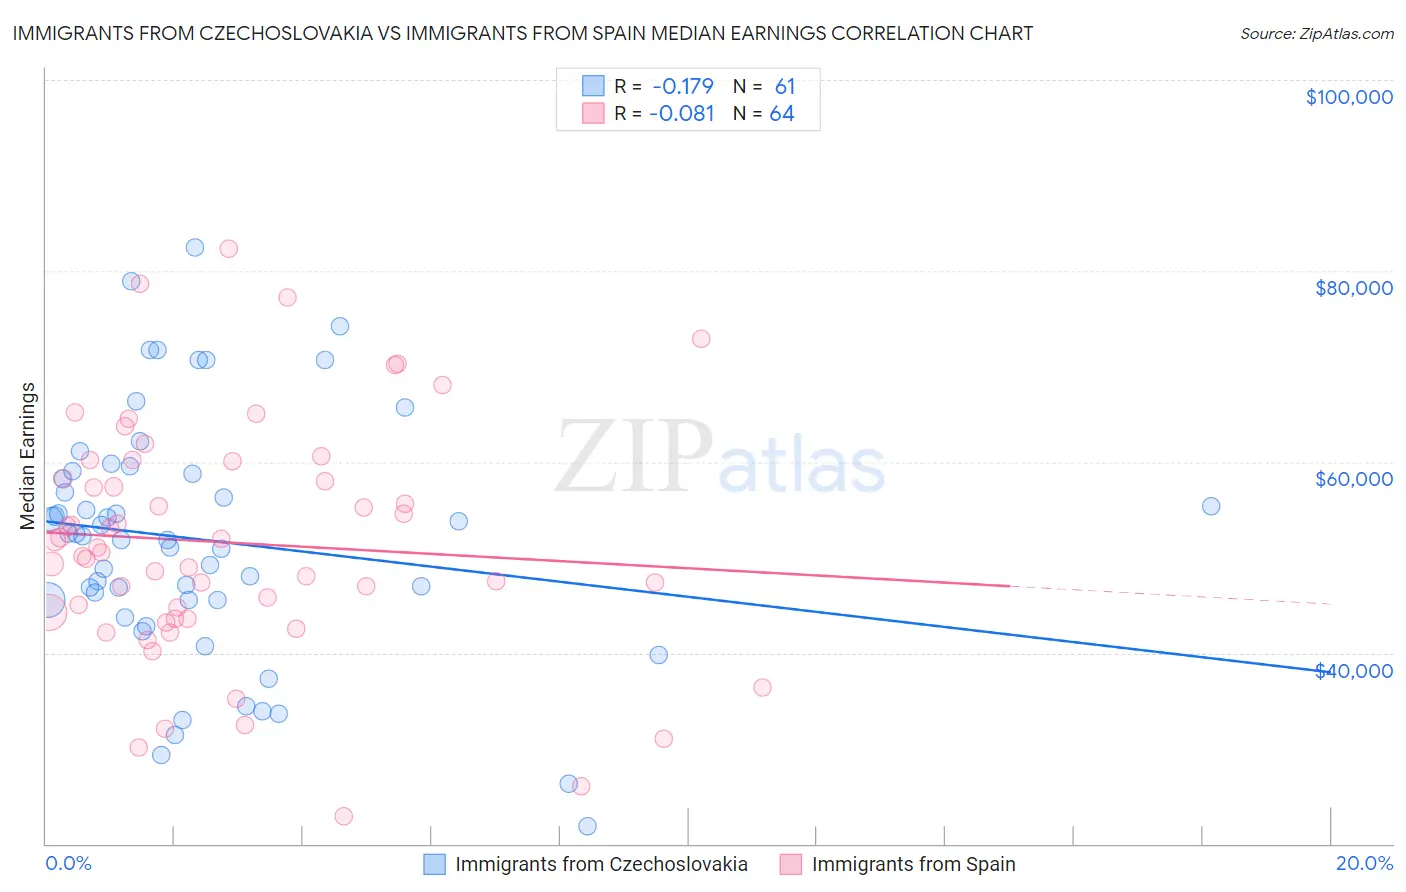
Immigrants from Czechoslovakia vs Immigrants from Spain Median Earnings Correlation Chart
The statistical analysis conducted on geographies consisting of 195,449,585 people shows a poor negative correlation between the proportion of Immigrants from Czechoslovakia and median earnings in the United States with a correlation coefficient (R) of -0.179 and weighted average of $52,361. Similarly, the statistical analysis conducted on geographies consisting of 239,665,603 people shows a slight negative correlation between the proportion of Immigrants from Spain and median earnings in the United States with a correlation coefficient (R) of -0.081 and weighted average of $51,092, a difference of 2.5%.
Median Earnings Correlation Summary
| Measurement | Immigrants from Czechoslovakia | Immigrants from Spain |
| Minimum | $21,875 | $22,920 |
| Maximum | $82,450 | $82,356 |
| Range | $60,575 | $59,436 |
| Mean | $51,817 | $51,542 |
| Median | $52,166 | $50,726 |
| Interquartile 25% (IQ1) | $45,495 | $43,899 |
| Interquartile 75% (IQ3) | $58,910 | $59,167 |
| Interquartile Range (IQR) | $13,415 | $15,268 |
| Standard Deviation (Sample) | $12,779 | $12,392 |
| Standard Deviation (Population) | $12,674 | $12,295 |
Similar Demographics by Median Earnings
Demographics Similar to Immigrants from Czechoslovakia by Median Earnings
In terms of median earnings, the demographic groups most similar to Immigrants from Czechoslovakia are Bhutanese ($52,297, a difference of 0.12%), Australian ($52,294, a difference of 0.13%), Immigrants from Malaysia ($52,514, a difference of 0.29%), Bulgarian ($52,512, a difference of 0.29%), and Maltese ($52,526, a difference of 0.31%).
| Demographics | Rating | Rank | Median Earnings |
| Latvians | 100.0 /100 | #38 | Exceptional $53,001 |
| Immigrants | Turkey | 100.0 /100 | #39 | Exceptional $52,960 |
| Israelis | 100.0 /100 | #40 | Exceptional $52,937 |
| Immigrants | Lithuania | 100.0 /100 | #41 | Exceptional $52,769 |
| Maltese | 100.0 /100 | #42 | Exceptional $52,526 |
| Immigrants | Malaysia | 100.0 /100 | #43 | Exceptional $52,514 |
| Bulgarians | 100.0 /100 | #44 | Exceptional $52,512 |
| Immigrants | Czechoslovakia | 100.0 /100 | #45 | Exceptional $52,361 |
| Bhutanese | 100.0 /100 | #46 | Exceptional $52,297 |
| Australians | 100.0 /100 | #47 | Exceptional $52,294 |
| Immigrants | Europe | 100.0 /100 | #48 | Exceptional $52,195 |
| Bolivians | 100.0 /100 | #49 | Exceptional $52,005 |
| Immigrants | South Africa | 100.0 /100 | #50 | Exceptional $51,850 |
| Immigrants | Austria | 99.9 /100 | #51 | Exceptional $51,826 |
| Estonians | 99.9 /100 | #52 | Exceptional $51,772 |
Demographics Similar to Immigrants from Spain by Median Earnings
In terms of median earnings, the demographic groups most similar to Immigrants from Spain are Afghan ($51,112, a difference of 0.040%), Paraguayan ($51,068, a difference of 0.050%), Mongolian ($51,038, a difference of 0.11%), Greek ($51,164, a difference of 0.14%), and Lithuanian ($50,991, a difference of 0.20%).
| Demographics | Rating | Rank | Median Earnings |
| Immigrants | Serbia | 99.9 /100 | #60 | Exceptional $51,557 |
| Immigrants | Latvia | 99.9 /100 | #61 | Exceptional $51,555 |
| Immigrants | Romania | 99.9 /100 | #62 | Exceptional $51,337 |
| Immigrants | Bulgaria | 99.9 /100 | #63 | Exceptional $51,318 |
| New Zealanders | 99.9 /100 | #64 | Exceptional $51,246 |
| Greeks | 99.9 /100 | #65 | Exceptional $51,164 |
| Afghans | 99.9 /100 | #66 | Exceptional $51,112 |
| Immigrants | Spain | 99.9 /100 | #67 | Exceptional $51,092 |
| Paraguayans | 99.9 /100 | #68 | Exceptional $51,068 |
| Mongolians | 99.8 /100 | #69 | Exceptional $51,038 |
| Lithuanians | 99.8 /100 | #70 | Exceptional $50,991 |
| Immigrants | Ukraine | 99.8 /100 | #71 | Exceptional $50,984 |
| Immigrants | Egypt | 99.8 /100 | #72 | Exceptional $50,901 |
| Immigrants | Netherlands | 99.8 /100 | #73 | Exceptional $50,818 |
| South Africans | 99.8 /100 | #74 | Exceptional $50,752 |