Immigrants from Czechoslovakia vs New Zealander Median Earnings
COMPARE
Immigrants from Czechoslovakia
New Zealander
Median Earnings
Median Earnings Comparison
Immigrants from Czechoslovakia
New Zealanders
$52,361
MEDIAN EARNINGS
100.0/ 100
METRIC RATING
45th/ 347
METRIC RANK
$51,246
MEDIAN EARNINGS
99.9/ 100
METRIC RATING
64th/ 347
METRIC RANK
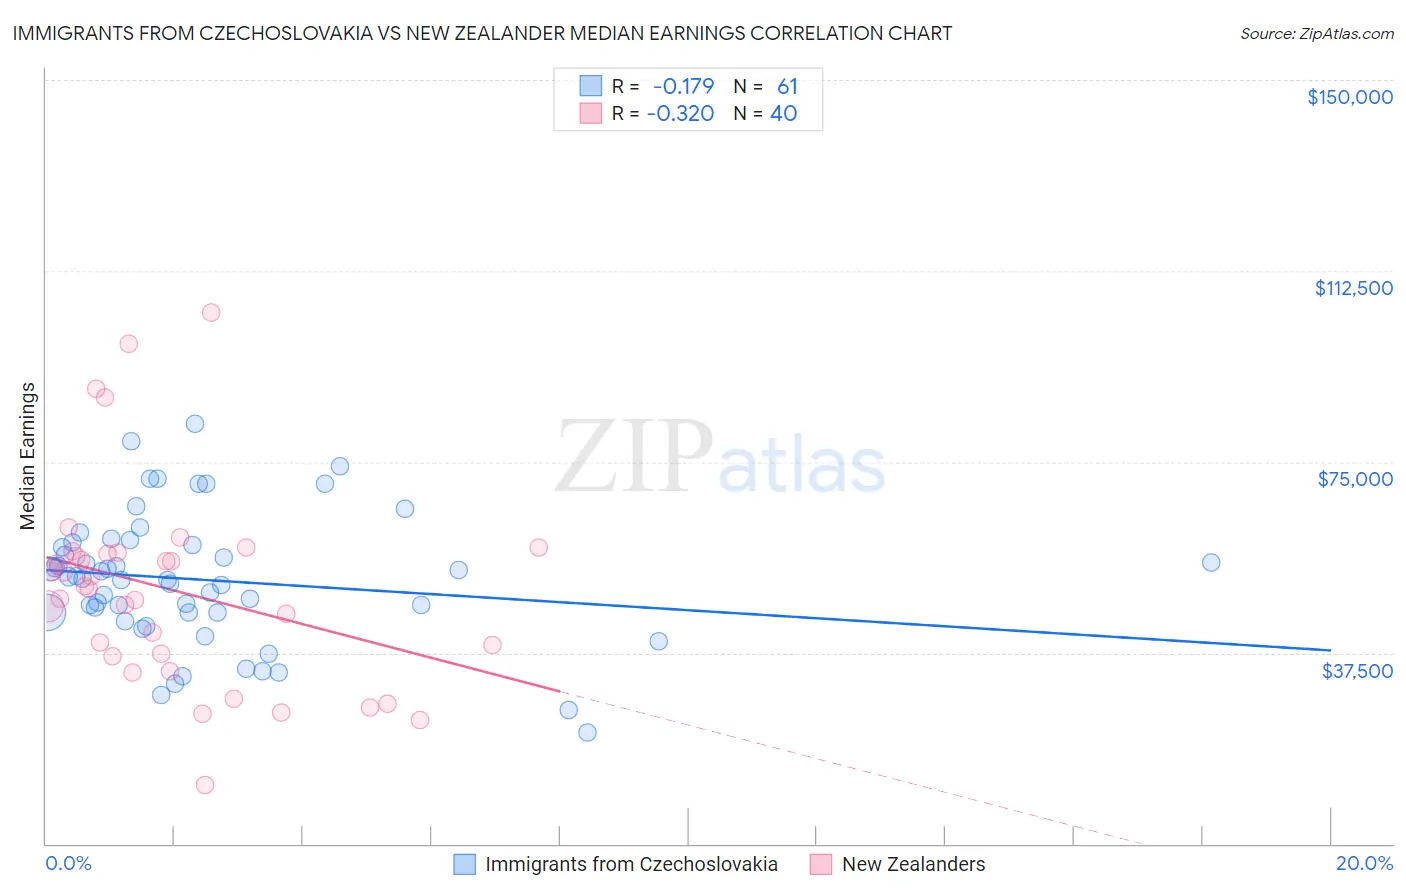
Immigrants from Czechoslovakia vs New Zealander Median Earnings Correlation Chart
The statistical analysis conducted on geographies consisting of 195,449,585 people shows a poor negative correlation between the proportion of Immigrants from Czechoslovakia and median earnings in the United States with a correlation coefficient (R) of -0.179 and weighted average of $52,361. Similarly, the statistical analysis conducted on geographies consisting of 106,916,811 people shows a mild negative correlation between the proportion of New Zealanders and median earnings in the United States with a correlation coefficient (R) of -0.320 and weighted average of $51,246, a difference of 2.2%.
Median Earnings Correlation Summary
| Measurement | Immigrants from Czechoslovakia | New Zealander |
| Minimum | $21,875 | $11,591 |
| Maximum | $82,450 | $104,409 |
| Range | $60,575 | $92,818 |
| Mean | $51,817 | $49,845 |
| Median | $52,166 | $50,398 |
| Interquartile 25% (IQ1) | $45,495 | $37,107 |
| Interquartile 75% (IQ3) | $58,910 | $57,034 |
| Interquartile Range (IQR) | $13,415 | $19,927 |
| Standard Deviation (Sample) | $12,779 | $19,630 |
| Standard Deviation (Population) | $12,674 | $19,383 |
Demographics Similar to Immigrants from Czechoslovakia and New Zealanders by Median Earnings
In terms of median earnings, the demographic groups most similar to Immigrants from Czechoslovakia are Bhutanese ($52,297, a difference of 0.12%), Australian ($52,294, a difference of 0.13%), Bulgarian ($52,512, a difference of 0.29%), Immigrants from Europe ($52,195, a difference of 0.32%), and Bolivian ($52,005, a difference of 0.69%). Similarly, the demographic groups most similar to New Zealanders are Immigrants from Bulgaria ($51,318, a difference of 0.14%), Immigrants from Romania ($51,337, a difference of 0.18%), Immigrants from Latvia ($51,555, a difference of 0.60%), Immigrants from Serbia ($51,557, a difference of 0.61%), and Immigrants from Croatia ($51,581, a difference of 0.65%).
| Demographics | Rating | Rank | Median Earnings |
| Bulgarians | 100.0 /100 | #44 | Exceptional $52,512 |
| Immigrants | Czechoslovakia | 100.0 /100 | #45 | Exceptional $52,361 |
| Bhutanese | 100.0 /100 | #46 | Exceptional $52,297 |
| Australians | 100.0 /100 | #47 | Exceptional $52,294 |
| Immigrants | Europe | 100.0 /100 | #48 | Exceptional $52,195 |
| Bolivians | 100.0 /100 | #49 | Exceptional $52,005 |
| Immigrants | South Africa | 100.0 /100 | #50 | Exceptional $51,850 |
| Immigrants | Austria | 99.9 /100 | #51 | Exceptional $51,826 |
| Estonians | 99.9 /100 | #52 | Exceptional $51,772 |
| Immigrants | Norway | 99.9 /100 | #53 | Exceptional $51,758 |
| Immigrants | Indonesia | 99.9 /100 | #54 | Exceptional $51,715 |
| Egyptians | 99.9 /100 | #55 | Exceptional $51,701 |
| Immigrants | Pakistan | 99.9 /100 | #56 | Exceptional $51,693 |
| Immigrants | Eastern Europe | 99.9 /100 | #57 | Exceptional $51,624 |
| Immigrants | Bolivia | 99.9 /100 | #58 | Exceptional $51,605 |
| Immigrants | Croatia | 99.9 /100 | #59 | Exceptional $51,581 |
| Immigrants | Serbia | 99.9 /100 | #60 | Exceptional $51,557 |
| Immigrants | Latvia | 99.9 /100 | #61 | Exceptional $51,555 |
| Immigrants | Romania | 99.9 /100 | #62 | Exceptional $51,337 |
| Immigrants | Bulgaria | 99.9 /100 | #63 | Exceptional $51,318 |
| New Zealanders | 99.9 /100 | #64 | Exceptional $51,246 |