Immigrants from Cuba vs Israeli Vision Disability
COMPARE
Immigrants from Cuba
Israeli
Vision Disability
Vision Disability Comparison
Immigrants from Cuba
Israelis
2.5%
VISION DISABILITY
0.0/ 100
METRIC RATING
290th/ 347
METRIC RANK
2.0%
VISION DISABILITY
99.6/ 100
METRIC RATING
48th/ 347
METRIC RANK
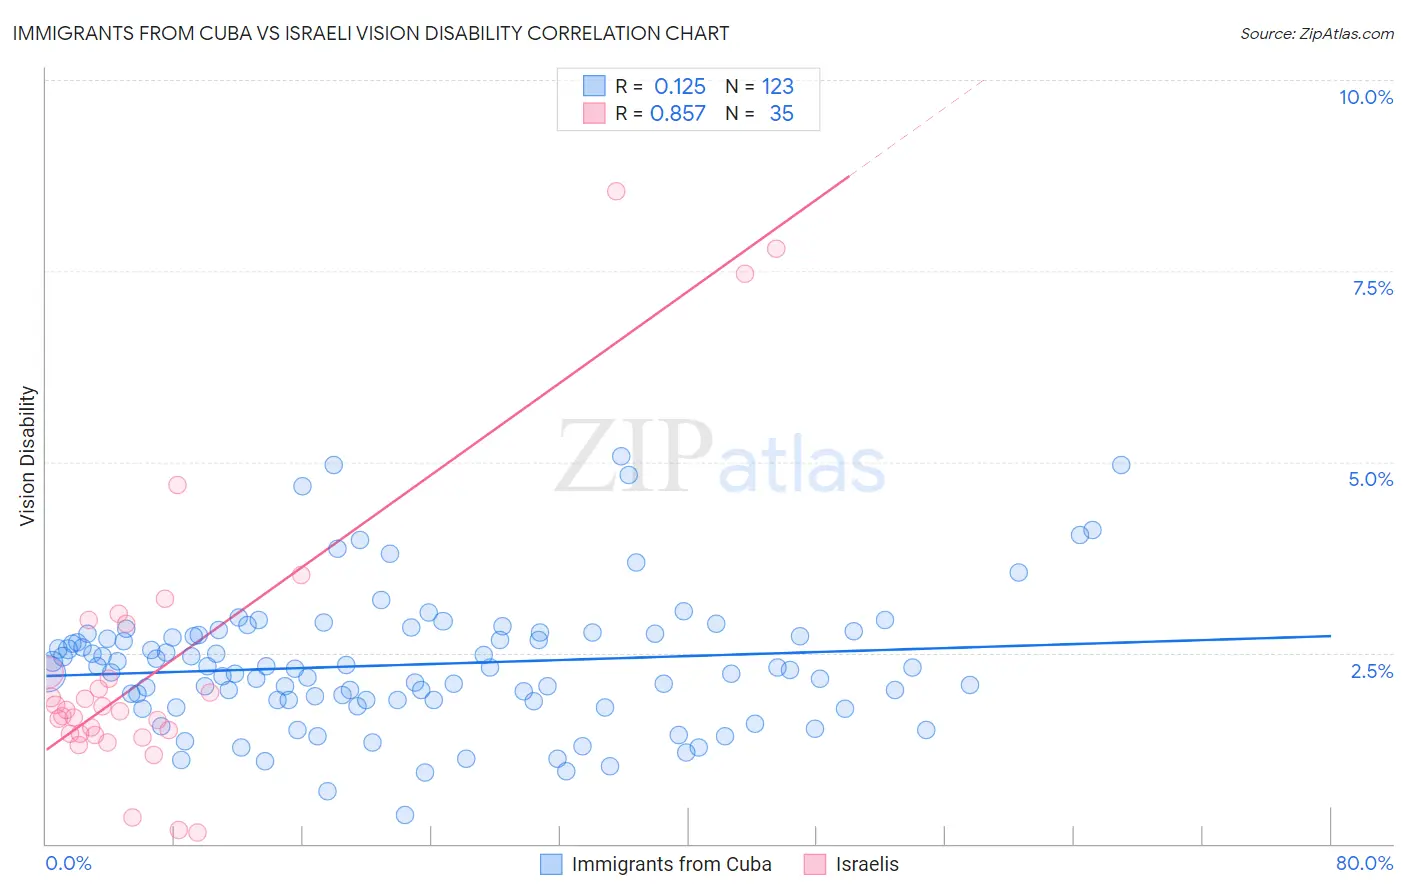
Immigrants from Cuba vs Israeli Vision Disability Correlation Chart
The statistical analysis conducted on geographies consisting of 325,877,901 people shows a poor positive correlation between the proportion of Immigrants from Cuba and percentage of population with vision disability in the United States with a correlation coefficient (R) of 0.125 and weighted average of 2.5%. Similarly, the statistical analysis conducted on geographies consisting of 211,077,295 people shows a very strong positive correlation between the proportion of Israelis and percentage of population with vision disability in the United States with a correlation coefficient (R) of 0.857 and weighted average of 2.0%, a difference of 25.3%.
Vision Disability Correlation Summary
| Measurement | Immigrants from Cuba | Israeli |
| Minimum | 0.38% | 0.15% |
| Maximum | 5.1% | 8.5% |
| Range | 4.7% | 8.4% |
| Mean | 2.3% | 2.4% |
| Median | 2.3% | 1.8% |
| Interquartile 25% (IQ1) | 1.9% | 1.4% |
| Interquartile 75% (IQ3) | 2.7% | 2.9% |
| Interquartile Range (IQR) | 0.87% | 1.4% |
| Standard Deviation (Sample) | 0.87% | 1.9% |
| Standard Deviation (Population) | 0.87% | 1.9% |
Similar Demographics by Vision Disability
Demographics Similar to Immigrants from Cuba by Vision Disability
In terms of vision disability, the demographic groups most similar to Immigrants from Cuba are Nonimmigrants (2.5%, a difference of 0.14%), Immigrants from Honduras (2.5%, a difference of 0.39%), Crow (2.5%, a difference of 0.49%), Yaqui (2.5%, a difference of 0.52%), and French American Indian (2.5%, a difference of 0.55%).
| Demographics | Rating | Rank | Vision Disability |
| Puget Sound Salish | 0.0 /100 | #283 | Tragic 2.5% |
| Yakama | 0.0 /100 | #284 | Tragic 2.5% |
| Immigrants | Central America | 0.0 /100 | #285 | Tragic 2.5% |
| Sioux | 0.0 /100 | #286 | Tragic 2.5% |
| Hondurans | 0.0 /100 | #287 | Tragic 2.5% |
| French American Indians | 0.0 /100 | #288 | Tragic 2.5% |
| Immigrants | Nonimmigrants | 0.0 /100 | #289 | Tragic 2.5% |
| Immigrants | Cuba | 0.0 /100 | #290 | Tragic 2.5% |
| Immigrants | Honduras | 0.0 /100 | #291 | Tragic 2.5% |
| Crow | 0.0 /100 | #292 | Tragic 2.5% |
| Yaqui | 0.0 /100 | #293 | Tragic 2.5% |
| Ottawa | 0.0 /100 | #294 | Tragic 2.5% |
| Delaware | 0.0 /100 | #295 | Tragic 2.5% |
| Immigrants | Mexico | 0.0 /100 | #296 | Tragic 2.5% |
| Immigrants | Dominica | 0.0 /100 | #297 | Tragic 2.5% |
Demographics Similar to Israelis by Vision Disability
In terms of vision disability, the demographic groups most similar to Israelis are Latvian (2.0%, a difference of 0.070%), Afghan (2.0%, a difference of 0.13%), Tongan (2.0%, a difference of 0.22%), Immigrants from Bulgaria (2.0%, a difference of 0.46%), and Immigrants from Sweden (2.0%, a difference of 0.48%).
| Demographics | Rating | Rank | Vision Disability |
| Cypriots | 99.7 /100 | #41 | Exceptional 2.0% |
| Immigrants | Ethiopia | 99.7 /100 | #42 | Exceptional 2.0% |
| Eastern Europeans | 99.7 /100 | #43 | Exceptional 2.0% |
| Immigrants | Indonesia | 99.7 /100 | #44 | Exceptional 2.0% |
| Ethiopians | 99.7 /100 | #45 | Exceptional 2.0% |
| Immigrants | Sweden | 99.7 /100 | #46 | Exceptional 2.0% |
| Immigrants | Bulgaria | 99.7 /100 | #47 | Exceptional 2.0% |
| Israelis | 99.6 /100 | #48 | Exceptional 2.0% |
| Latvians | 99.5 /100 | #49 | Exceptional 2.0% |
| Afghans | 99.5 /100 | #50 | Exceptional 2.0% |
| Tongans | 99.5 /100 | #51 | Exceptional 2.0% |
| Immigrants | Serbia | 99.4 /100 | #52 | Exceptional 2.0% |
| Immigrants | Belarus | 99.3 /100 | #53 | Exceptional 2.0% |
| Macedonians | 99.3 /100 | #54 | Exceptional 2.0% |
| Laotians | 99.3 /100 | #55 | Exceptional 2.0% |