Immigrants from Cuba vs Nigerian Householder Income Over 65 years
COMPARE
Immigrants from Cuba
Nigerian
Householder Income Over 65 years
Householder Income Over 65 years Comparison
Immigrants from Cuba
Nigerians
$44,735
HOUSEHOLDER INCOME OVER 65 YEARS
0.0/ 100
METRIC RATING
345th/ 347
METRIC RANK
$58,992
HOUSEHOLDER INCOME OVER 65 YEARS
11.2/ 100
METRIC RATING
210th/ 347
METRIC RANK
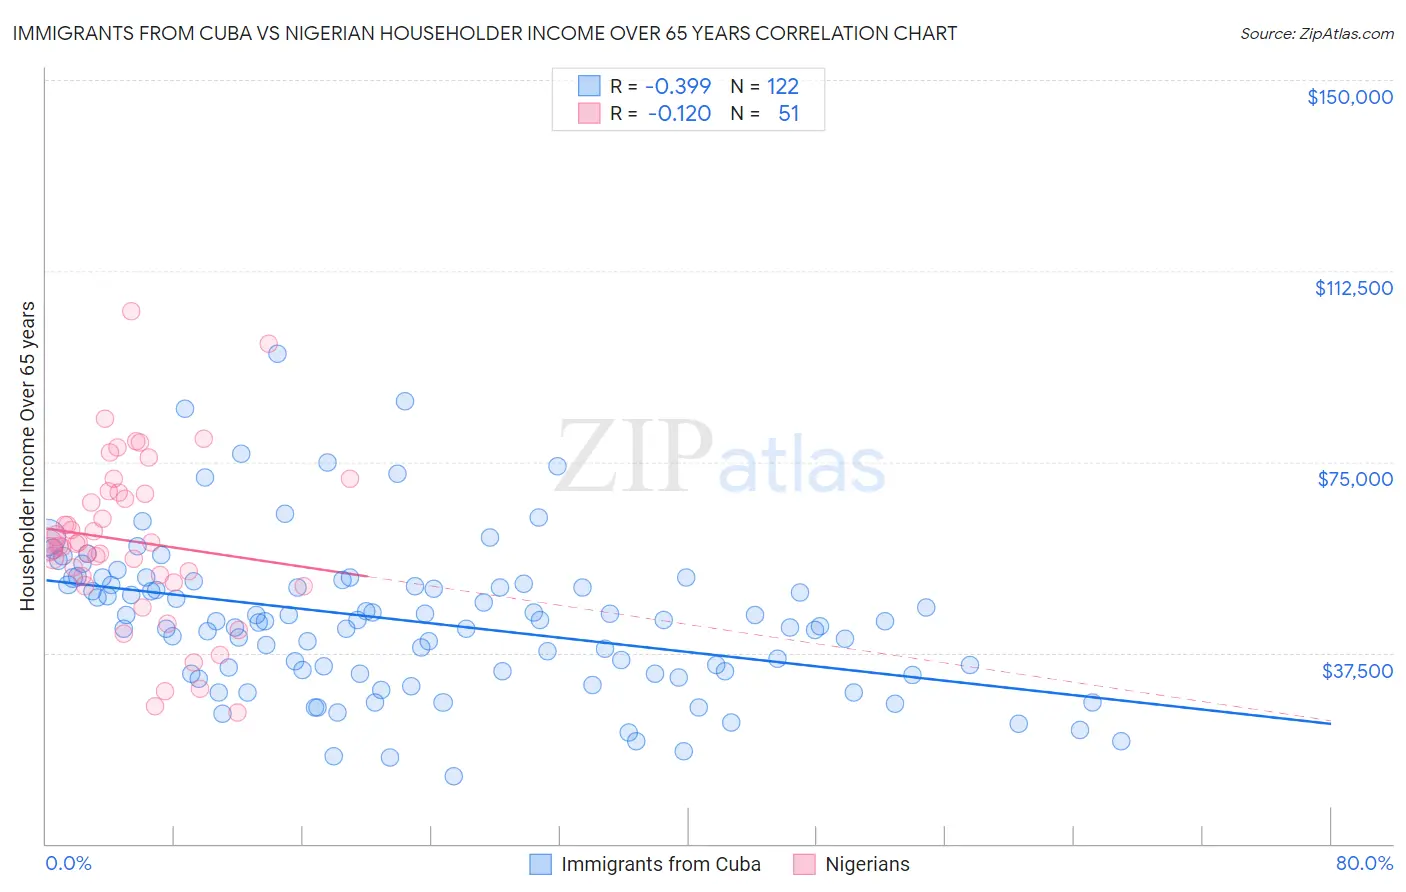
Immigrants from Cuba vs Nigerian Householder Income Over 65 years Correlation Chart
The statistical analysis conducted on geographies consisting of 325,279,041 people shows a mild negative correlation between the proportion of Immigrants from Cuba and household income with householder over the age of 65 in the United States with a correlation coefficient (R) of -0.399 and weighted average of $44,735. Similarly, the statistical analysis conducted on geographies consisting of 331,517,190 people shows a poor negative correlation between the proportion of Nigerians and household income with householder over the age of 65 in the United States with a correlation coefficient (R) of -0.120 and weighted average of $58,992, a difference of 31.9%.
Householder Income Over 65 years Correlation Summary
| Measurement | Immigrants from Cuba | Nigerian |
| Minimum | $13,371 | $25,694 |
| Maximum | $96,328 | $104,625 |
| Range | $82,957 | $78,931 |
| Mean | $43,660 | $59,394 |
| Median | $43,594 | $58,564 |
| Interquartile 25% (IQ1) | $33,500 | $51,335 |
| Interquartile 75% (IQ3) | $50,867 | $68,991 |
| Interquartile Range (IQR) | $17,367 | $17,656 |
| Standard Deviation (Sample) | $14,765 | $16,370 |
| Standard Deviation (Population) | $14,705 | $16,209 |
Similar Demographics by Householder Income Over 65 years
Demographics Similar to Immigrants from Cuba by Householder Income Over 65 years
In terms of householder income over 65 years, the demographic groups most similar to Immigrants from Cuba are Houma ($44,822, a difference of 0.19%), Immigrants from Dominican Republic ($45,758, a difference of 2.3%), Immigrants from Cabo Verde ($46,654, a difference of 4.3%), Dominican ($46,964, a difference of 5.0%), and Puerto Rican ($42,550, a difference of 5.1%).
| Demographics | Rating | Rank | Householder Income Over 65 years |
| Cape Verdeans | 0.0 /100 | #333 | Tragic $50,077 |
| Immigrants | Dominica | 0.0 /100 | #334 | Tragic $50,071 |
| Crow | 0.0 /100 | #335 | Tragic $49,234 |
| Cubans | 0.0 /100 | #336 | Tragic $49,152 |
| Tohono O'odham | 0.0 /100 | #337 | Tragic $49,121 |
| Immigrants | Caribbean | 0.0 /100 | #338 | Tragic $48,535 |
| Navajo | 0.0 /100 | #339 | Tragic $47,722 |
| Immigrants | Yemen | 0.0 /100 | #340 | Tragic $47,527 |
| Dominicans | 0.0 /100 | #341 | Tragic $46,964 |
| Immigrants | Cabo Verde | 0.0 /100 | #342 | Tragic $46,654 |
| Immigrants | Dominican Republic | 0.0 /100 | #343 | Tragic $45,758 |
| Houma | 0.0 /100 | #344 | Tragic $44,822 |
| Immigrants | Cuba | 0.0 /100 | #345 | Tragic $44,735 |
| Puerto Ricans | 0.0 /100 | #346 | Tragic $42,550 |
| Lumbee | 0.0 /100 | #347 | Tragic $40,550 |
Demographics Similar to Nigerians by Householder Income Over 65 years
In terms of householder income over 65 years, the demographic groups most similar to Nigerians are Slovak ($59,039, a difference of 0.080%), Immigrants from Nigeria ($58,942, a difference of 0.090%), Uruguayan ($59,090, a difference of 0.17%), Colombian ($58,851, a difference of 0.24%), and Salvadoran ($59,141, a difference of 0.25%).
| Demographics | Rating | Rank | Householder Income Over 65 years |
| Scotch-Irish | 16.9 /100 | #203 | Poor $59,447 |
| Arapaho | 16.0 /100 | #204 | Poor $59,383 |
| Immigrants | Sudan | 14.2 /100 | #205 | Poor $59,248 |
| Immigrants | South America | 13.0 /100 | #206 | Poor $59,151 |
| Salvadorans | 12.9 /100 | #207 | Poor $59,141 |
| Uruguayans | 12.3 /100 | #208 | Poor $59,090 |
| Slovaks | 11.7 /100 | #209 | Poor $59,039 |
| Nigerians | 11.2 /100 | #210 | Poor $58,992 |
| Immigrants | Nigeria | 10.7 /100 | #211 | Poor $58,942 |
| Colombians | 9.8 /100 | #212 | Tragic $58,851 |
| Whites/Caucasians | 9.8 /100 | #213 | Tragic $58,847 |
| Nepalese | 9.0 /100 | #214 | Tragic $58,761 |
| Immigrants | Ghana | 7.9 /100 | #215 | Tragic $58,624 |
| Immigrants | Middle Africa | 6.2 /100 | #216 | Tragic $58,375 |
| Sudanese | 5.7 /100 | #217 | Tragic $58,281 |