Ghanaian vs Bhutanese Median Male Earnings

COMPARE

Ghanaian
Race
Ancestry
AfghanAfricanAlaska NativeAlaskan AthabascanAlbanianAleutAlsatianAmericanApacheArabArapahoArgentineanArmenianAssyrian/Chaldean/SyriacAustralianAustrianBahamianBangladeshiBarbadianBasqueBelgianBelizeanBermudanBlackfeetBolivianBrazilianBritishBritish West IndianBulgarianBurmeseCajunCambodianCanadianCape VerdeanCarpatho RusynCelticCentral AmericanCentral American IndianCherokeeCheyenneChickasawChileanChineseChippewaChoctawColombianColvilleComancheCosta RicanCreeCreekCroatianCrowCubanCypriotCzechCzechoslovakianDanishDelawareDominicanDutchDutch West IndianEastern EuropeanEcuadorianEgyptianEnglishEstonianEthiopianEuropeanFijianFilipinoFinnishFrenchFrench American IndianFrench CanadianGermanGerman RussianGhanaianGreekGuamanian/ChamorroGuatemalanGuyaneseHaitianHmongHonduranHopiHoumaHungarianIcelanderIndian (Asian)IndonesianInupiatIranianIraqiIrishIroquoisIsraeliItalianJamaicanJapaneseJordanianKenyanKiowaKoreanLaotianLatvianLebaneseLiberianLithuanianLumbeeLuxembourgerMacedonianMalaysianMalteseMarshalleseMenomineeMexicanMexican American IndianMongolianMoroccanNative HawaiianNavajoNepaleseNew ZealanderNicaraguanNigerianNorthern EuropeanNorwegianOkinawanOsageOttawaPaiutePakistaniPalestinianPanamanianParaguayanPennsylvania GermanPeruvianPimaPolishPortuguesePotawatomiPuebloPuerto RicanPuget Sound SalishRomanianRussianSalvadoranSamoanScandinavianScotch-IrishScottishSeminoleSenegaleseSerbianShoshoneSierra LeoneanSiouxSlavicSlovakSloveneSomaliSouth AfricanSouth AmericanSouth American IndianSoviet UnionSpaniardSpanishSpanish AmericanSpanish American IndianSri LankanSubsaharan AfricanSudaneseSwedishSwissSyrianTaiwaneseThaiTlingit-HaidaTohono O'OdhamTonganTrinidadian and TobagonianTsimshianTurkishU.S. Virgin IslanderUgandanUkrainianUruguayanUteVenezuelanVietnameseWelshWest IndianYakamaYaquiYugoslavianYumanYup'ikZimbabwean
Immigration
NonimmigrantsImmigrantsAfghanistanAfricaAlbaniaArgentinaArmeniaAsiaAustraliaAustriaBahamasBangladeshBarbadosBelarusBelgiumBelizeBoliviaBosnia and HerzegovinaBrazilBulgariaBurma/MyanmarCabo VerdeCambodiaCameroonCanadaCaribbeanCentral AmericaChileChinaColombiaCongoCosta RicaCroatiaCubaCzechoslovakiaDenmarkDominicaDominican RepublicEastern AfricaEastern AsiaEastern EuropeEcuadorEgyptEl SalvadorEnglandEritreaEthiopiaEuropeFijiFranceGermanyGhanaGreeceGrenadaGuatemalaGuyanaHaitiHondurasHong KongHungaryIndiaIndonesiaIranIraqIrelandIsraelItalyJamaicaJapanJordanKazakhstanKenyaKoreaKuwaitLaosLatin AmericaLatviaLebanonLiberiaLithuaniaMalaysiaMexicoMicronesiaMiddle AfricaMoldovaMoroccoNepalNetherlandsNicaraguaNigeriaNorth AmericaNorth MacedoniaNorthern AfricaNorthern EuropeNorwayOceaniaPakistanPanamaPeruPhilippinesPolandPortugalRomaniaRussiaSaudi ArabiaScotlandSenegalSerbiaSierra LeoneSingaporeSomaliaSouth AfricaSouth AmericaSouth Central AsiaSouth Eastern AsiaSouthern EuropeSpainSri LankaSt. Vincent and the GrenadinesSudanSwedenSwitzerlandSyriaTaiwanThailandTrinidad and TobagoTurkeyUgandaUkraineUruguayUzbekistanVenezuelaVietnamWest IndiesWestern AfricaWestern AsiaWestern EuropeYemenZaireZimbabweAzores
Bhutanese
Race
Ancestry
AfghanAfricanAlaska NativeAlaskan AthabascanAlbanianAleutAlsatianAmericanApacheArabArapahoArgentineanArmenianAssyrian/Chaldean/SyriacAustralianAustrianBahamianBangladeshiBarbadianBasqueBelgianBelizeanBermudanBhutaneseBlackfeetBolivianBrazilianBritishBritish West IndianBulgarianBurmeseCajunCambodianCanadianCape VerdeanCarpatho RusynCelticCentral AmericanCentral American IndianCherokeeCheyenneChickasawChileanChineseChippewaChoctawColombianColvilleComancheCosta RicanCreeCreekCroatianCrowCubanCypriotCzechCzechoslovakianDanishDelawareDominicanDutchDutch West IndianEastern EuropeanEcuadorianEgyptianEnglishEstonianEthiopianEuropeanFijianFilipinoFinnishFrenchFrench American IndianFrench CanadianGermanGerman RussianGreekGuamanian/ChamorroGuatemalanGuyaneseHaitianHmongHonduranHopiHoumaHungarianIcelanderIndian (Asian)IndonesianInupiatIranianIraqiIrishIroquoisIsraeliItalianJamaicanJapaneseJordanianKenyanKiowaKoreanLaotianLatvianLebaneseLiberianLithuanianLumbeeLuxembourgerMacedonianMalaysianMalteseMarshalleseMenomineeMexicanMexican American IndianMongolianMoroccanNative HawaiianNavajoNepaleseNew ZealanderNicaraguanNigerianNorthern EuropeanNorwegianOkinawanOsageOttawaPaiutePakistaniPalestinianPanamanianParaguayanPennsylvania GermanPeruvianPimaPolishPortuguesePotawatomiPuebloPuerto RicanPuget Sound SalishRomanianRussianSalvadoranSamoanScandinavianScotch-IrishScottishSeminoleSenegaleseSerbianShoshoneSierra LeoneanSiouxSlavicSlovakSloveneSomaliSouth AfricanSouth AmericanSouth American IndianSoviet UnionSpaniardSpanishSpanish AmericanSpanish American IndianSri LankanSubsaharan AfricanSudaneseSwedishSwissSyrianTaiwaneseThaiTlingit-HaidaTohono O'OdhamTonganTrinidadian and TobagonianTsimshianTurkishU.S. Virgin IslanderUgandanUkrainianUruguayanUteVenezuelanVietnameseWelshWest IndianYakamaYaquiYugoslavianYumanYup'ikZimbabwean
Immigration
NonimmigrantsImmigrantsAfghanistanAfricaAlbaniaArgentinaArmeniaAsiaAustraliaAustriaBahamasBangladeshBarbadosBelarusBelgiumBelizeBoliviaBosnia and HerzegovinaBrazilBulgariaBurma/MyanmarCabo VerdeCambodiaCameroonCanadaCaribbeanCentral AmericaChileChinaColombiaCongoCosta RicaCroatiaCubaCzechoslovakiaDenmarkDominicaDominican RepublicEastern AfricaEastern AsiaEastern EuropeEcuadorEgyptEl SalvadorEnglandEritreaEthiopiaEuropeFijiFranceGermanyGhanaGreeceGrenadaGuatemalaGuyanaHaitiHondurasHong KongHungaryIndiaIndonesiaIranIraqIrelandIsraelItalyJamaicaJapanJordanKazakhstanKenyaKoreaKuwaitLaosLatin AmericaLatviaLebanonLiberiaLithuaniaMalaysiaMexicoMicronesiaMiddle AfricaMoldovaMoroccoNepalNetherlandsNicaraguaNigeriaNorth AmericaNorth MacedoniaNorthern AfricaNorthern EuropeNorwayOceaniaPakistanPanamaPeruPhilippinesPolandPortugalRomaniaRussiaSaudi ArabiaScotlandSenegalSerbiaSierra LeoneSingaporeSomaliaSouth AfricaSouth AmericaSouth Central AsiaSouth Eastern AsiaSouthern EuropeSpainSri LankaSt. Vincent and the GrenadinesSudanSwedenSwitzerlandSyriaTaiwanThailandTrinidad and TobagoTurkeyUgandaUkraineUruguayUzbekistanVenezuelaVietnamWest IndiesWestern AfricaWestern AsiaWestern EuropeYemenZaireZimbabweAzores
Median Male Earnings
Income
Poverty
Unemployment
Labor Participation
Family Structure
Vehicle Availability
Education Level
Disability

Median Male Earnings Comparison

Ghanaians

Bhutanese

Poor
Exceptional
$52,810
MEDIAN MALE EARNINGS
16.1/ 100
METRIC RATING
204th/ 347
METRIC RANK
$61,759
MEDIAN MALE EARNINGS
99.9/ 100
METRIC RATING
50th/ 347
METRIC RANK

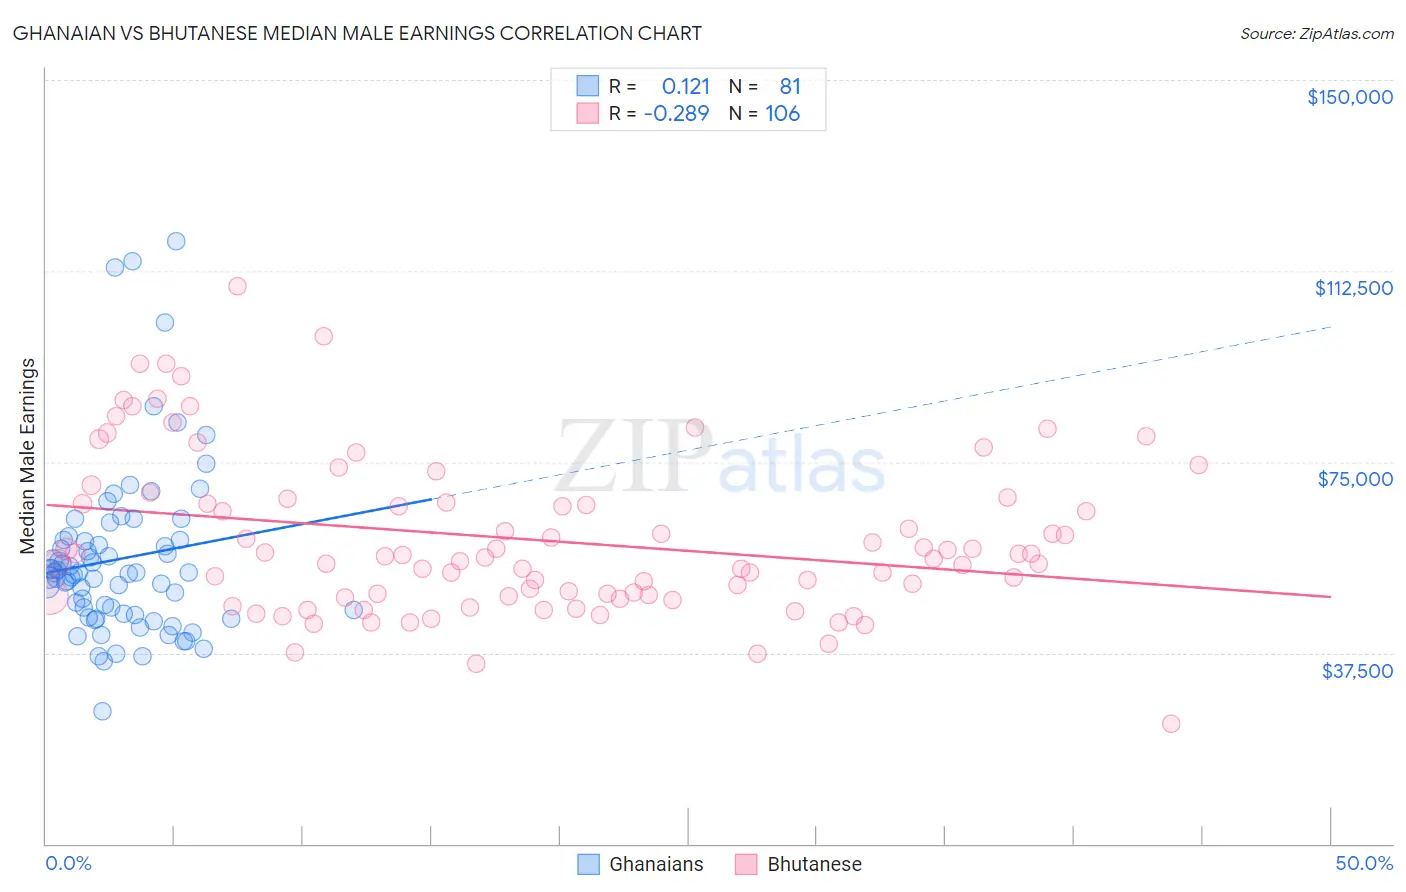
Ghanaian vs Bhutanese Median Male Earnings Correlation Chart

The statistical analysis conducted on geographies consisting of 190,703,925 people shows a poor positive correlation between the proportion of Ghanaians and median male earnings in the United States with a correlation coefficient (R) of 0.121 and weighted average of $52,810. Similarly, the statistical analysis conducted on geographies consisting of 455,387,679 people shows a weak negative correlation between the proportion of Bhutanese and median male earnings in the United States with a correlation coefficient (R) of -0.289 and weighted average of $61,759, a difference of 17.0%.
Ghanaian vs Bhutanese Median Male Earnings

Median Male Earnings Correlation Summary

MeasurementGhanaianBhutanese
Minimum$26,089$23,594
Maximum$118,333$109,392
Range$92,244$85,798
Mean$55,935$59,697
Median$53,206$56,402
Interquartile 25% (IQ1)$44,949$48,730
Interquartile 75% (IQ3)$59,627$67,058
Interquartile Range (IQR)$14,678$18,327
Standard Deviation (Sample)$16,875$15,498
Standard Deviation (Population)$16,771$15,425

Similar Demographics by Median Male Earnings

Demographics Similar to Ghanaians by Median Male Earnings

In terms of median male earnings, the demographic groups most similar to Ghanaians are Panamanian ($52,835, a difference of 0.050%), Immigrants from Uruguay ($52,860, a difference of 0.10%), Immigrants from Bosnia and Herzegovina ($52,869, a difference of 0.11%), Immigrants from Colombia ($52,725, a difference of 0.16%), and Immigrants from Thailand ($52,908, a difference of 0.19%).
DemographicsRating | RankMedian Male Earnings
Immigrants | Kenya
26.0
/100
|
#197
Fair
$53,427
Immigrants | Costa Rica
22.6
/100
|
#198
Fair
$53,237
Tongans
22.3
/100
|
#199
Fair
$53,218
Immigrants | Thailand
17.5
/100
|
#200
Poor
$52,908
Immigrants | Bosnia and Herzegovina
16.9
/100
|
#201
Poor
$52,869
Immigrants | Uruguay
16.8
/100
|
#202
Poor
$52,860
Panamanians
16.5
/100
|
#203
Poor
$52,835
Ghanaians
16.1
/100
|
#204
Poor
$52,810
Immigrants | Colombia
15.0
/100
|
#205
Poor
$52,725
Immigrants | Iraq
14.5
/100
|
#206
Poor
$52,681
Vietnamese
12.7
/100
|
#207
Poor
$52,525
Venezuelans
12.5
/100
|
#208
Poor
$52,510
Bermudans
12.1
/100
|
#209
Poor
$52,465
Delaware
11.5
/100
|
#210
Poor
$52,412
Tlingit-Haida
11.5
/100
|
#211
Poor
$52,409

Demographics Similar to Bhutanese by Median Male Earnings

In terms of median male earnings, the demographic groups most similar to Bhutanese are Estonian ($61,710, a difference of 0.080%), Immigrants from Norway ($61,628, a difference of 0.21%), Immigrants from Europe ($62,057, a difference of 0.48%), South African ($61,460, a difference of 0.49%), and Immigrants from Latvia ($61,422, a difference of 0.55%).
DemographicsRating | RankMedian Male Earnings
Immigrants | Belarus
100.0
/100
|
#43
Exceptional
$62,658
Cambodians
100.0
/100
|
#44
Exceptional
$62,516
Bulgarians
100.0
/100
|
#45
Exceptional
$62,378
Immigrants | Czechoslovakia
99.9
/100
|
#46
Exceptional
$62,217
Immigrants | Austria
99.9
/100
|
#47
Exceptional
$62,164
Immigrants | Malaysia
99.9
/100
|
#48
Exceptional
$62,121
Immigrants | Europe
99.9
/100
|
#49
Exceptional
$62,057
Bhutanese
99.9
/100
|
#50
Exceptional
$61,759
Estonians
99.9
/100
|
#51
Exceptional
$61,710
Immigrants | Norway
99.9
/100
|
#52
Exceptional
$61,628
South Africans
99.9
/100
|
#53
Exceptional
$61,460
Immigrants | Latvia
99.9
/100
|
#54
Exceptional
$61,422
Greeks
99.9
/100
|
#55
Exceptional
$61,242
Lithuanians
99.9
/100
|
#56
Exceptional
$61,228
Immigrants | Scotland
99.9
/100
|
#57
Exceptional
$61,220