Immigrants from Romania vs Bhutanese Median Male Earnings
COMPARE
Immigrants from Romania
Bhutanese
Median Male Earnings
Median Male Earnings Comparison
Immigrants from Romania
Bhutanese
$61,040
MEDIAN MALE EARNINGS
99.8/ 100
METRIC RATING
62nd/ 347
METRIC RANK
$61,759
MEDIAN MALE EARNINGS
99.9/ 100
METRIC RATING
50th/ 347
METRIC RANK
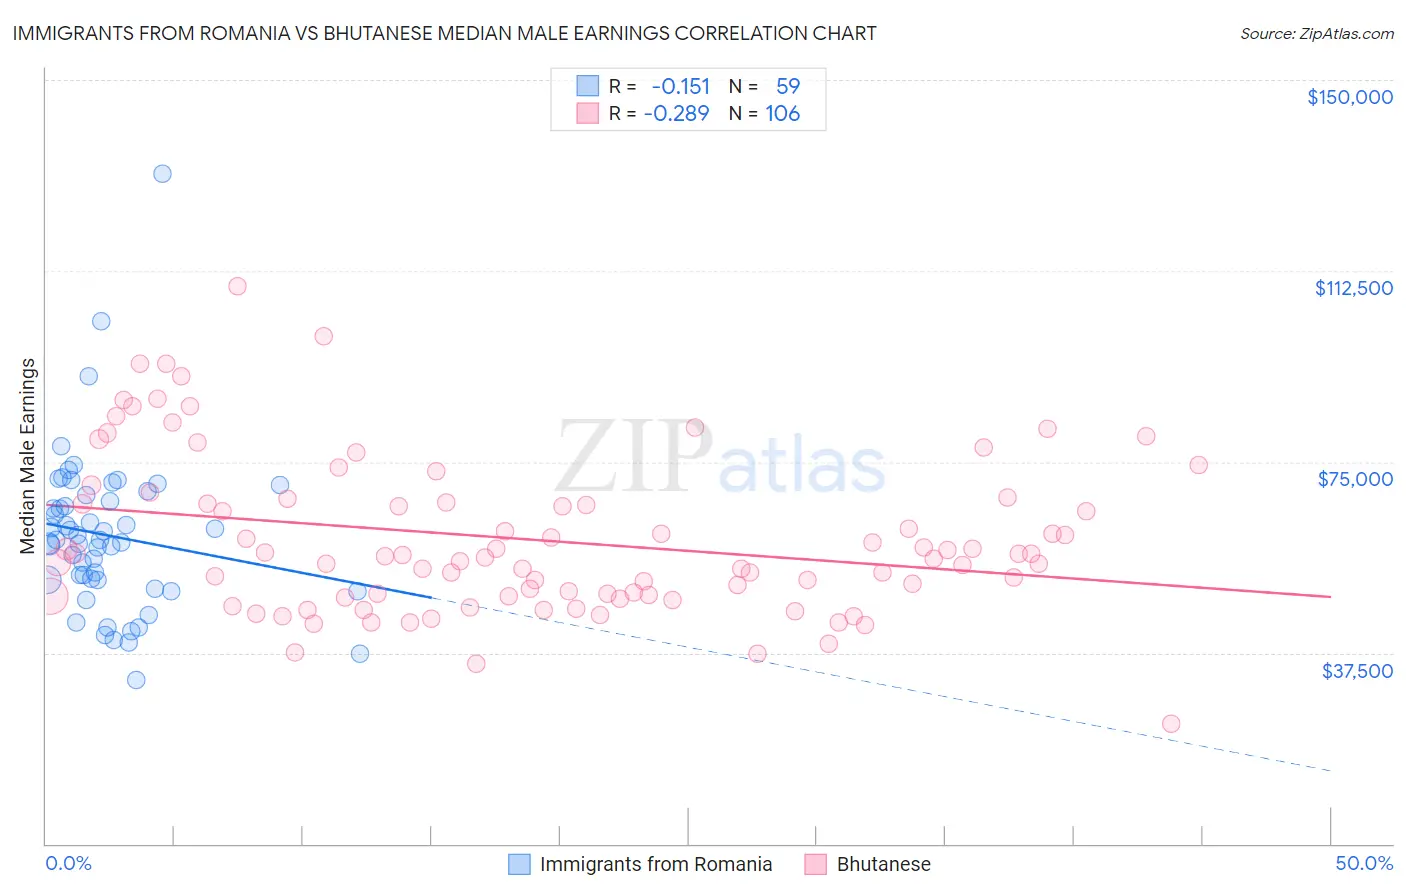
Immigrants from Romania vs Bhutanese Median Male Earnings Correlation Chart
The statistical analysis conducted on geographies consisting of 256,975,343 people shows a poor negative correlation between the proportion of Immigrants from Romania and median male earnings in the United States with a correlation coefficient (R) of -0.151 and weighted average of $61,040. Similarly, the statistical analysis conducted on geographies consisting of 455,387,679 people shows a weak negative correlation between the proportion of Bhutanese and median male earnings in the United States with a correlation coefficient (R) of -0.289 and weighted average of $61,759, a difference of 1.2%.
Median Male Earnings Correlation Summary
| Measurement | Immigrants from Romania | Bhutanese |
| Minimum | $32,206 | $23,594 |
| Maximum | $131,536 | $109,392 |
| Range | $99,330 | $85,798 |
| Mean | $60,508 | $59,697 |
| Median | $59,717 | $56,402 |
| Interquartile 25% (IQ1) | $51,701 | $48,730 |
| Interquartile 75% (IQ3) | $68,594 | $67,058 |
| Interquartile Range (IQR) | $16,893 | $18,327 |
| Standard Deviation (Sample) | $15,927 | $15,498 |
| Standard Deviation (Population) | $15,791 | $15,425 |
Demographics Similar to Immigrants from Romania and Bhutanese by Median Male Earnings
In terms of median male earnings, the demographic groups most similar to Immigrants from Romania are Bolivian ($61,066, a difference of 0.040%), Immigrants from Netherlands ($61,096, a difference of 0.090%), Egyptian ($61,095, a difference of 0.090%), Immigrants from Pakistan ($60,987, a difference of 0.090%), and Immigrants from Eastern Europe ($60,958, a difference of 0.13%). Similarly, the demographic groups most similar to Bhutanese are Estonian ($61,710, a difference of 0.080%), Immigrants from Norway ($61,628, a difference of 0.21%), Immigrants from Europe ($62,057, a difference of 0.48%), South African ($61,460, a difference of 0.49%), and Immigrants from Latvia ($61,422, a difference of 0.55%).
| Demographics | Rating | Rank | Median Male Earnings |
| Immigrants | Czechoslovakia | 99.9 /100 | #46 | Exceptional $62,217 |
| Immigrants | Austria | 99.9 /100 | #47 | Exceptional $62,164 |
| Immigrants | Malaysia | 99.9 /100 | #48 | Exceptional $62,121 |
| Immigrants | Europe | 99.9 /100 | #49 | Exceptional $62,057 |
| Bhutanese | 99.9 /100 | #50 | Exceptional $61,759 |
| Estonians | 99.9 /100 | #51 | Exceptional $61,710 |
| Immigrants | Norway | 99.9 /100 | #52 | Exceptional $61,628 |
| South Africans | 99.9 /100 | #53 | Exceptional $61,460 |
| Immigrants | Latvia | 99.9 /100 | #54 | Exceptional $61,422 |
| Greeks | 99.9 /100 | #55 | Exceptional $61,242 |
| Lithuanians | 99.9 /100 | #56 | Exceptional $61,228 |
| Immigrants | Scotland | 99.9 /100 | #57 | Exceptional $61,220 |
| New Zealanders | 99.9 /100 | #58 | Exceptional $61,199 |
| Immigrants | Netherlands | 99.8 /100 | #59 | Exceptional $61,096 |
| Egyptians | 99.8 /100 | #60 | Exceptional $61,095 |
| Bolivians | 99.8 /100 | #61 | Exceptional $61,066 |
| Immigrants | Romania | 99.8 /100 | #62 | Exceptional $61,040 |
| Immigrants | Pakistan | 99.8 /100 | #63 | Exceptional $60,987 |
| Immigrants | Eastern Europe | 99.8 /100 | #64 | Exceptional $60,958 |
| Immigrants | Indonesia | 99.8 /100 | #65 | Exceptional $60,935 |
| Immigrants | Croatia | 99.8 /100 | #66 | Exceptional $60,914 |