Immigrants from Congo vs South American Median Family Income
COMPARE
Immigrants from Congo
South American
Median Family Income
Median Family Income Comparison
Immigrants from Congo
South Americans
$82,216
MEDIAN FAMILY INCOME
0.0/ 100
METRIC RATING
326th/ 347
METRIC RANK
$101,856
MEDIAN FAMILY INCOME
39.7/ 100
METRIC RATING
179th/ 347
METRIC RANK
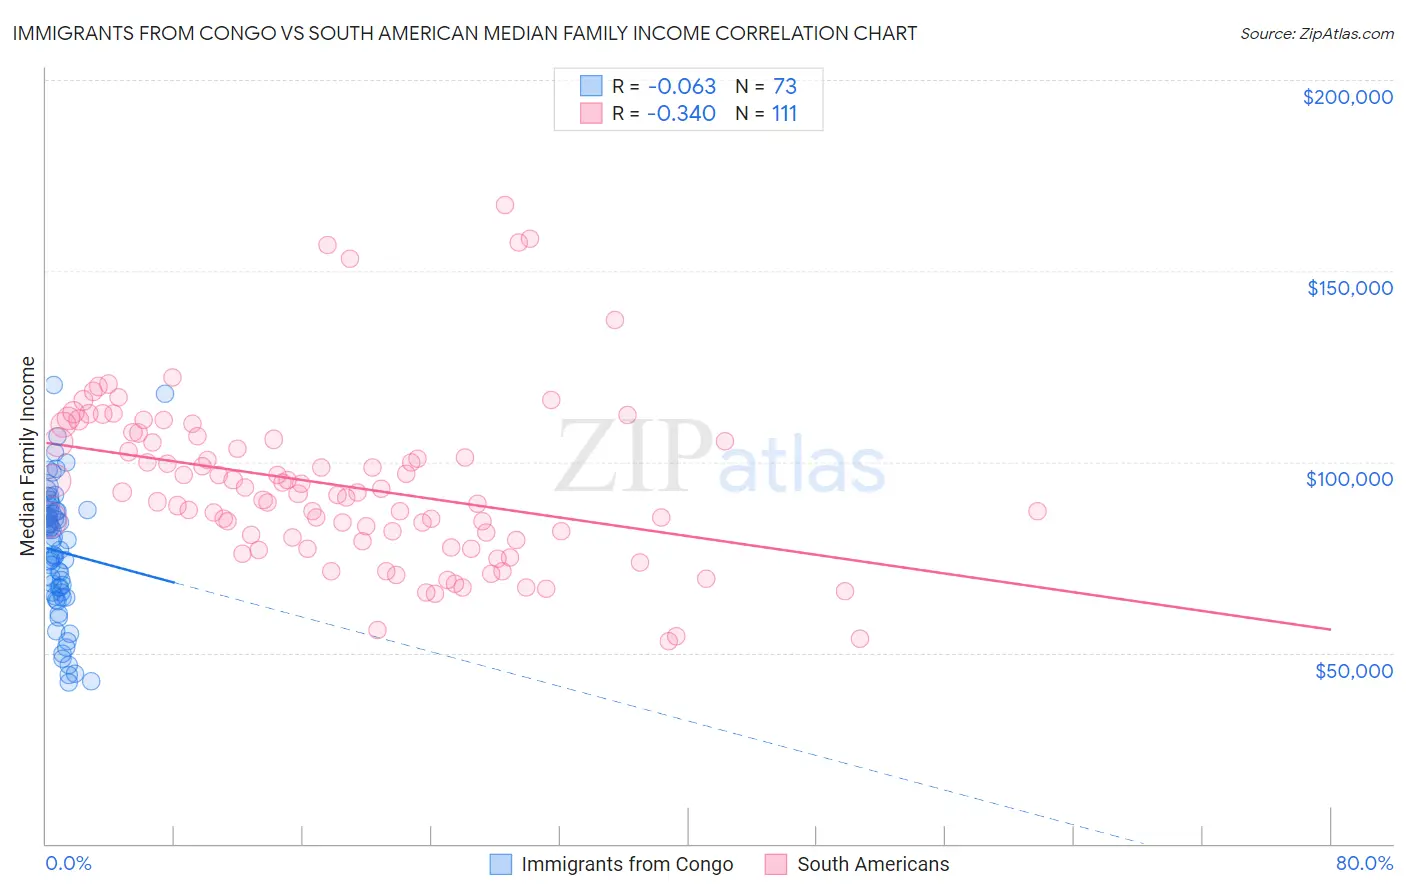
Immigrants from Congo vs South American Median Family Income Correlation Chart
The statistical analysis conducted on geographies consisting of 92,050,082 people shows a slight negative correlation between the proportion of Immigrants from Congo and median family income in the United States with a correlation coefficient (R) of -0.063 and weighted average of $82,216. Similarly, the statistical analysis conducted on geographies consisting of 493,360,337 people shows a mild negative correlation between the proportion of South Americans and median family income in the United States with a correlation coefficient (R) of -0.340 and weighted average of $101,856, a difference of 23.9%.
Median Family Income Correlation Summary
| Measurement | Immigrants from Congo | South American |
| Minimum | $42,229 | $53,167 |
| Maximum | $120,257 | $167,114 |
| Range | $78,028 | $113,947 |
| Mean | $76,553 | $93,843 |
| Median | $79,188 | $91,692 |
| Interquartile 25% (IQ1) | $65,174 | $79,466 |
| Interquartile 75% (IQ3) | $87,165 | $105,899 |
| Interquartile Range (IQR) | $21,991 | $26,433 |
| Standard Deviation (Sample) | $17,096 | $21,858 |
| Standard Deviation (Population) | $16,978 | $21,760 |
Similar Demographics by Median Family Income
Demographics Similar to Immigrants from Congo by Median Family Income
In terms of median family income, the demographic groups most similar to Immigrants from Congo are Arapaho ($82,064, a difference of 0.19%), Sioux ($82,386, a difference of 0.21%), Black/African American ($81,912, a difference of 0.37%), Creek ($82,560, a difference of 0.42%), and Dutch West Indian ($81,852, a difference of 0.45%).
| Demographics | Rating | Rank | Median Family Income |
| Immigrants | Honduras | 0.0 /100 | #319 | Tragic $83,618 |
| Seminole | 0.0 /100 | #320 | Tragic $83,354 |
| Immigrants | Caribbean | 0.0 /100 | #321 | Tragic $83,319 |
| Dominicans | 0.0 /100 | #322 | Tragic $82,888 |
| Bahamians | 0.0 /100 | #323 | Tragic $82,631 |
| Creek | 0.0 /100 | #324 | Tragic $82,560 |
| Sioux | 0.0 /100 | #325 | Tragic $82,386 |
| Immigrants | Congo | 0.0 /100 | #326 | Tragic $82,216 |
| Arapaho | 0.0 /100 | #327 | Tragic $82,064 |
| Blacks/African Americans | 0.0 /100 | #328 | Tragic $81,912 |
| Dutch West Indians | 0.0 /100 | #329 | Tragic $81,852 |
| Cheyenne | 0.0 /100 | #330 | Tragic $81,385 |
| Immigrants | Dominican Republic | 0.0 /100 | #331 | Tragic $81,233 |
| Natives/Alaskans | 0.0 /100 | #332 | Tragic $80,908 |
| Kiowa | 0.0 /100 | #333 | Tragic $80,885 |
Demographics Similar to South Americans by Median Family Income
In terms of median family income, the demographic groups most similar to South Americans are French Canadian ($101,634, a difference of 0.22%), Spaniard ($101,617, a difference of 0.23%), Welsh ($102,151, a difference of 0.29%), Tsimshian ($101,543, a difference of 0.31%), and German ($102,254, a difference of 0.39%).
| Demographics | Rating | Rank | Median Family Income |
| Immigrants | Eritrea | 51.9 /100 | #172 | Average $102,823 |
| Belgians | 51.4 /100 | #173 | Average $102,788 |
| Finns | 50.0 /100 | #174 | Average $102,676 |
| Immigrants | Eastern Africa | 47.1 /100 | #175 | Average $102,451 |
| French | 46.1 /100 | #176 | Average $102,368 |
| Germans | 44.6 /100 | #177 | Average $102,254 |
| Welsh | 43.3 /100 | #178 | Average $102,151 |
| South Americans | 39.7 /100 | #179 | Fair $101,856 |
| French Canadians | 37.0 /100 | #180 | Fair $101,634 |
| Spaniards | 36.8 /100 | #181 | Fair $101,617 |
| Tsimshian | 35.9 /100 | #182 | Fair $101,543 |
| Kenyans | 34.5 /100 | #183 | Fair $101,417 |
| Immigrants | Costa Rica | 33.7 /100 | #184 | Fair $101,354 |
| Dutch | 31.9 /100 | #185 | Fair $101,192 |
| Celtics | 31.3 /100 | #186 | Fair $101,139 |