Immigrants from Congo vs Inupiat Median Family Income
COMPARE
Immigrants from Congo
Inupiat
Median Family Income
Median Family Income Comparison
Immigrants from Congo
Inupiat
$82,216
MEDIAN FAMILY INCOME
0.0/ 100
METRIC RATING
326th/ 347
METRIC RANK
$91,730
MEDIAN FAMILY INCOME
0.4/ 100
METRIC RATING
261st/ 347
METRIC RANK
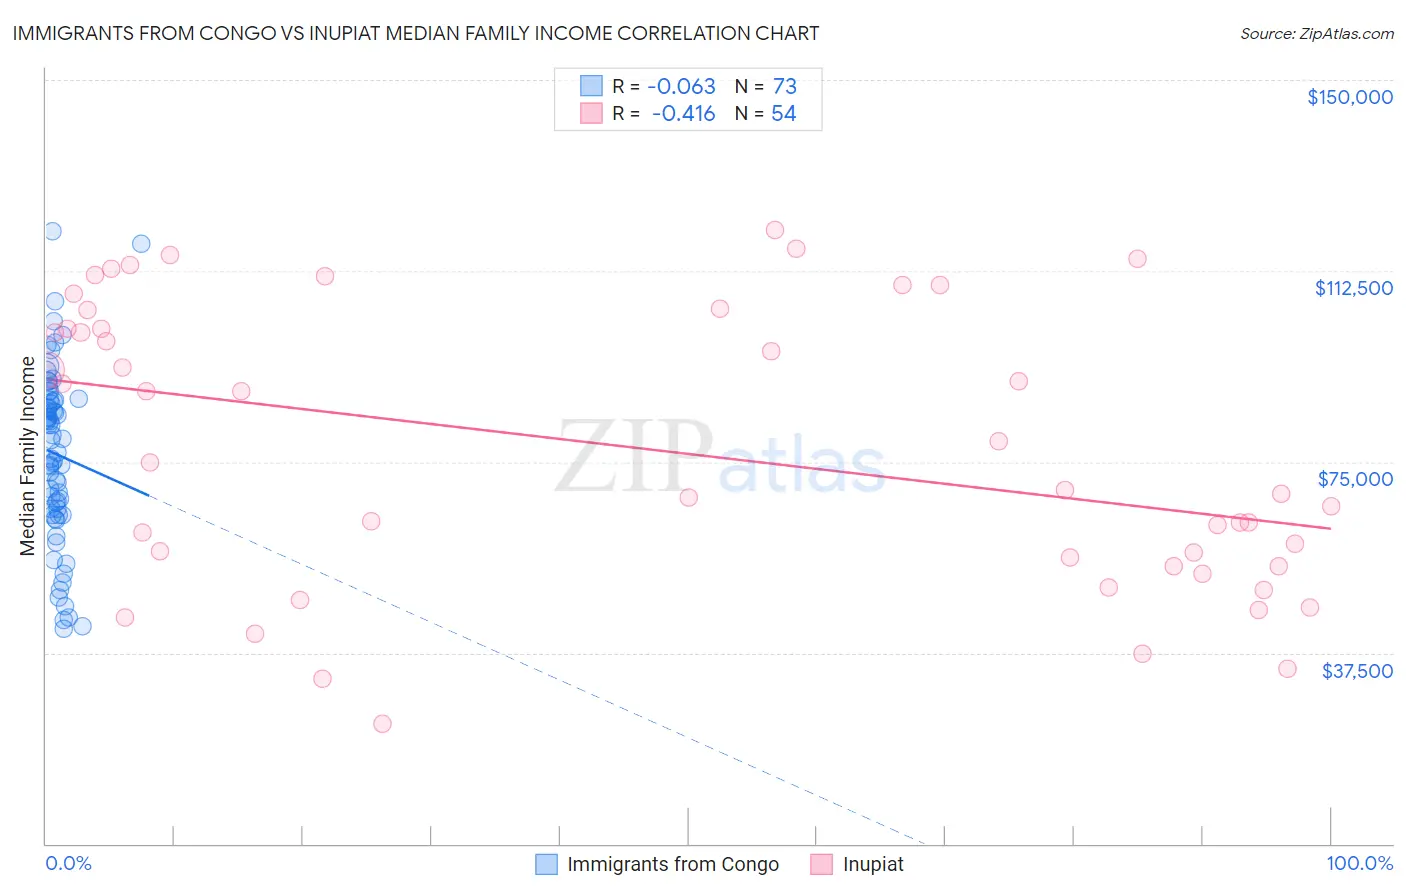
Immigrants from Congo vs Inupiat Median Family Income Correlation Chart
The statistical analysis conducted on geographies consisting of 92,050,082 people shows a slight negative correlation between the proportion of Immigrants from Congo and median family income in the United States with a correlation coefficient (R) of -0.063 and weighted average of $82,216. Similarly, the statistical analysis conducted on geographies consisting of 96,309,592 people shows a moderate negative correlation between the proportion of Inupiat and median family income in the United States with a correlation coefficient (R) of -0.416 and weighted average of $91,730, a difference of 11.6%.
Median Family Income Correlation Summary
| Measurement | Immigrants from Congo | Inupiat |
| Minimum | $42,229 | $23,690 |
| Maximum | $120,257 | $120,501 |
| Range | $78,028 | $96,811 |
| Mean | $76,553 | $77,500 |
| Median | $79,188 | $72,103 |
| Interquartile 25% (IQ1) | $65,174 | $54,583 |
| Interquartile 75% (IQ3) | $87,165 | $101,242 |
| Interquartile Range (IQR) | $21,991 | $46,659 |
| Standard Deviation (Sample) | $17,096 | $27,340 |
| Standard Deviation (Population) | $16,978 | $27,086 |
Similar Demographics by Median Family Income
Demographics Similar to Immigrants from Congo by Median Family Income
In terms of median family income, the demographic groups most similar to Immigrants from Congo are Arapaho ($82,064, a difference of 0.19%), Sioux ($82,386, a difference of 0.21%), Black/African American ($81,912, a difference of 0.37%), Creek ($82,560, a difference of 0.42%), and Dutch West Indian ($81,852, a difference of 0.45%).
| Demographics | Rating | Rank | Median Family Income |
| Immigrants | Honduras | 0.0 /100 | #319 | Tragic $83,618 |
| Seminole | 0.0 /100 | #320 | Tragic $83,354 |
| Immigrants | Caribbean | 0.0 /100 | #321 | Tragic $83,319 |
| Dominicans | 0.0 /100 | #322 | Tragic $82,888 |
| Bahamians | 0.0 /100 | #323 | Tragic $82,631 |
| Creek | 0.0 /100 | #324 | Tragic $82,560 |
| Sioux | 0.0 /100 | #325 | Tragic $82,386 |
| Immigrants | Congo | 0.0 /100 | #326 | Tragic $82,216 |
| Arapaho | 0.0 /100 | #327 | Tragic $82,064 |
| Blacks/African Americans | 0.0 /100 | #328 | Tragic $81,912 |
| Dutch West Indians | 0.0 /100 | #329 | Tragic $81,852 |
| Cheyenne | 0.0 /100 | #330 | Tragic $81,385 |
| Immigrants | Dominican Republic | 0.0 /100 | #331 | Tragic $81,233 |
| Natives/Alaskans | 0.0 /100 | #332 | Tragic $80,908 |
| Kiowa | 0.0 /100 | #333 | Tragic $80,885 |
Demographics Similar to Inupiat by Median Family Income
In terms of median family income, the demographic groups most similar to Inupiat are Liberian ($91,722, a difference of 0.010%), Pennsylvania German ($91,763, a difference of 0.040%), Cape Verdean ($91,848, a difference of 0.13%), Immigrants from West Indies ($91,588, a difference of 0.16%), and Osage ($91,926, a difference of 0.21%).
| Demographics | Rating | Rank | Median Family Income |
| Immigrants | Barbados | 0.5 /100 | #254 | Tragic $92,419 |
| Immigrants | Laos | 0.5 /100 | #255 | Tragic $92,239 |
| Nicaraguans | 0.5 /100 | #256 | Tragic $92,231 |
| Americans | 0.4 /100 | #257 | Tragic $92,096 |
| Osage | 0.4 /100 | #258 | Tragic $91,926 |
| Cape Verdeans | 0.4 /100 | #259 | Tragic $91,848 |
| Pennsylvania Germans | 0.4 /100 | #260 | Tragic $91,763 |
| Inupiat | 0.4 /100 | #261 | Tragic $91,730 |
| Liberians | 0.4 /100 | #262 | Tragic $91,722 |
| Immigrants | West Indies | 0.3 /100 | #263 | Tragic $91,588 |
| Senegalese | 0.3 /100 | #264 | Tragic $91,475 |
| Hmong | 0.3 /100 | #265 | Tragic $91,296 |
| Central Americans | 0.3 /100 | #266 | Tragic $91,087 |
| Mexican American Indians | 0.2 /100 | #267 | Tragic $90,918 |
| Cree | 0.2 /100 | #268 | Tragic $90,882 |