Immigrants from Congo vs Immigrants from Belize Per Capita Income
COMPARE
Immigrants from Congo
Immigrants from Belize
Per Capita Income
Per Capita Income Comparison
Immigrants from Congo
Immigrants from Belize
$35,720
PER CAPITA INCOME
0.0/ 100
METRIC RATING
319th/ 347
METRIC RANK
$38,614
PER CAPITA INCOME
0.3/ 100
METRIC RATING
270th/ 347
METRIC RANK
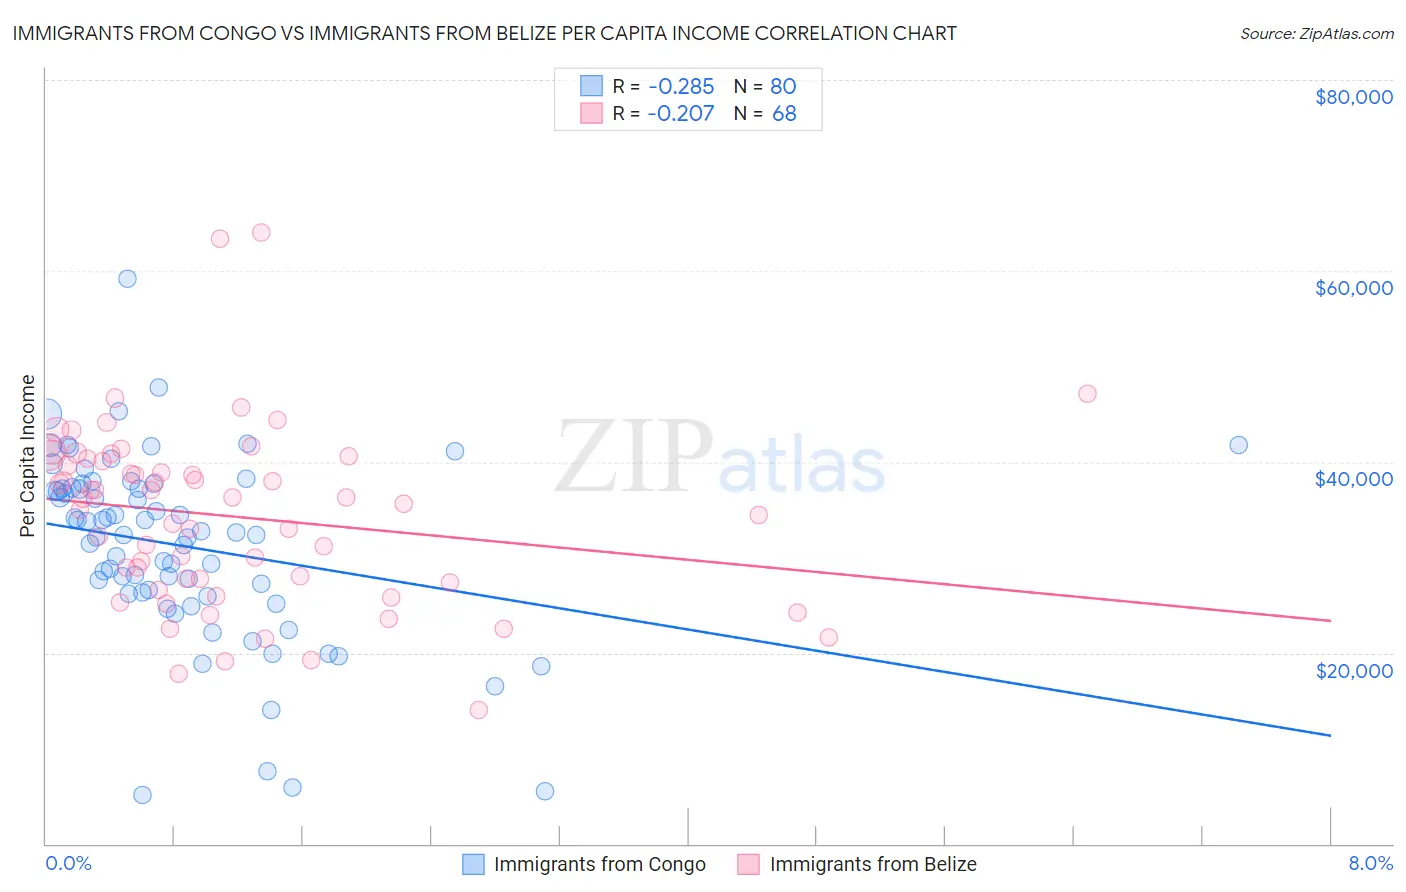
Immigrants from Congo vs Immigrants from Belize Per Capita Income Correlation Chart
The statistical analysis conducted on geographies consisting of 92,126,617 people shows a weak negative correlation between the proportion of Immigrants from Congo and per capita income in the United States with a correlation coefficient (R) of -0.285 and weighted average of $35,720. Similarly, the statistical analysis conducted on geographies consisting of 130,314,146 people shows a weak negative correlation between the proportion of Immigrants from Belize and per capita income in the United States with a correlation coefficient (R) of -0.207 and weighted average of $38,614, a difference of 8.1%.
Per Capita Income Correlation Summary
| Measurement | Immigrants from Congo | Immigrants from Belize |
| Minimum | $5,075 | $13,974 |
| Maximum | $59,125 | $63,996 |
| Range | $54,050 | $50,022 |
| Mean | $31,172 | $34,271 |
| Median | $32,475 | $35,906 |
| Interquartile 25% (IQ1) | $26,293 | $27,515 |
| Interquartile 75% (IQ3) | $37,243 | $40,202 |
| Interquartile Range (IQR) | $10,950 | $12,687 |
| Standard Deviation (Sample) | $9,699 | $9,371 |
| Standard Deviation (Population) | $9,639 | $9,302 |
Similar Demographics by Per Capita Income
Demographics Similar to Immigrants from Congo by Per Capita Income
In terms of per capita income, the demographic groups most similar to Immigrants from Congo are Hispanic or Latino ($35,688, a difference of 0.090%), Black/African American ($35,564, a difference of 0.44%), Creek ($35,546, a difference of 0.49%), Bangladeshi ($35,897, a difference of 0.50%), and Dutch West Indian ($35,922, a difference of 0.57%).
| Demographics | Rating | Rank | Per Capita Income |
| Chickasaw | 0.0 /100 | #312 | Tragic $36,475 |
| Bahamians | 0.0 /100 | #313 | Tragic $36,427 |
| Seminole | 0.0 /100 | #314 | Tragic $36,180 |
| Yaqui | 0.0 /100 | #315 | Tragic $36,112 |
| Choctaw | 0.0 /100 | #316 | Tragic $35,999 |
| Dutch West Indians | 0.0 /100 | #317 | Tragic $35,922 |
| Bangladeshis | 0.0 /100 | #318 | Tragic $35,897 |
| Immigrants | Congo | 0.0 /100 | #319 | Tragic $35,720 |
| Hispanics or Latinos | 0.0 /100 | #320 | Tragic $35,688 |
| Blacks/African Americans | 0.0 /100 | #321 | Tragic $35,564 |
| Creek | 0.0 /100 | #322 | Tragic $35,546 |
| Cheyenne | 0.0 /100 | #323 | Tragic $35,276 |
| Kiowa | 0.0 /100 | #324 | Tragic $35,102 |
| Immigrants | Central America | 0.0 /100 | #325 | Tragic $34,974 |
| Immigrants | Cuba | 0.0 /100 | #326 | Tragic $34,910 |
Demographics Similar to Immigrants from Belize by Per Capita Income
In terms of per capita income, the demographic groups most similar to Immigrants from Belize are Central American ($38,560, a difference of 0.14%), Immigrants from Cabo Verde ($38,540, a difference of 0.19%), Immigrants from Jamaica ($38,766, a difference of 0.39%), Liberian ($38,780, a difference of 0.43%), and Nepalese ($38,442, a difference of 0.45%).
| Demographics | Rating | Rank | Per Capita Income |
| Belizeans | 0.6 /100 | #263 | Tragic $39,097 |
| Americans | 0.6 /100 | #264 | Tragic $39,039 |
| Spanish Americans | 0.5 /100 | #265 | Tragic $39,012 |
| Salvadorans | 0.5 /100 | #266 | Tragic $38,858 |
| Immigrants | Zaire | 0.4 /100 | #267 | Tragic $38,848 |
| Liberians | 0.4 /100 | #268 | Tragic $38,780 |
| Immigrants | Jamaica | 0.4 /100 | #269 | Tragic $38,766 |
| Immigrants | Belize | 0.3 /100 | #270 | Tragic $38,614 |
| Central Americans | 0.3 /100 | #271 | Tragic $38,560 |
| Immigrants | Cabo Verde | 0.3 /100 | #272 | Tragic $38,540 |
| Nepalese | 0.3 /100 | #273 | Tragic $38,442 |
| Immigrants | El Salvador | 0.3 /100 | #274 | Tragic $38,394 |
| Immigrants | Liberia | 0.2 /100 | #275 | Tragic $38,165 |
| Hmong | 0.2 /100 | #276 | Tragic $38,120 |
| Comanche | 0.2 /100 | #277 | Tragic $38,088 |