Immigrants from Congo vs Immigrants from Costa Rica High School Diploma
COMPARE
Immigrants from Congo
Immigrants from Costa Rica
High School Diploma
High School Diploma Comparison
Immigrants from Congo
Immigrants from Costa Rica
87.0%
HIGH SCHOOL DIPLOMA
0.2/ 100
METRIC RATING
266th/ 347
METRIC RANK
87.8%
HIGH SCHOOL DIPLOMA
1.7/ 100
METRIC RATING
247th/ 347
METRIC RANK
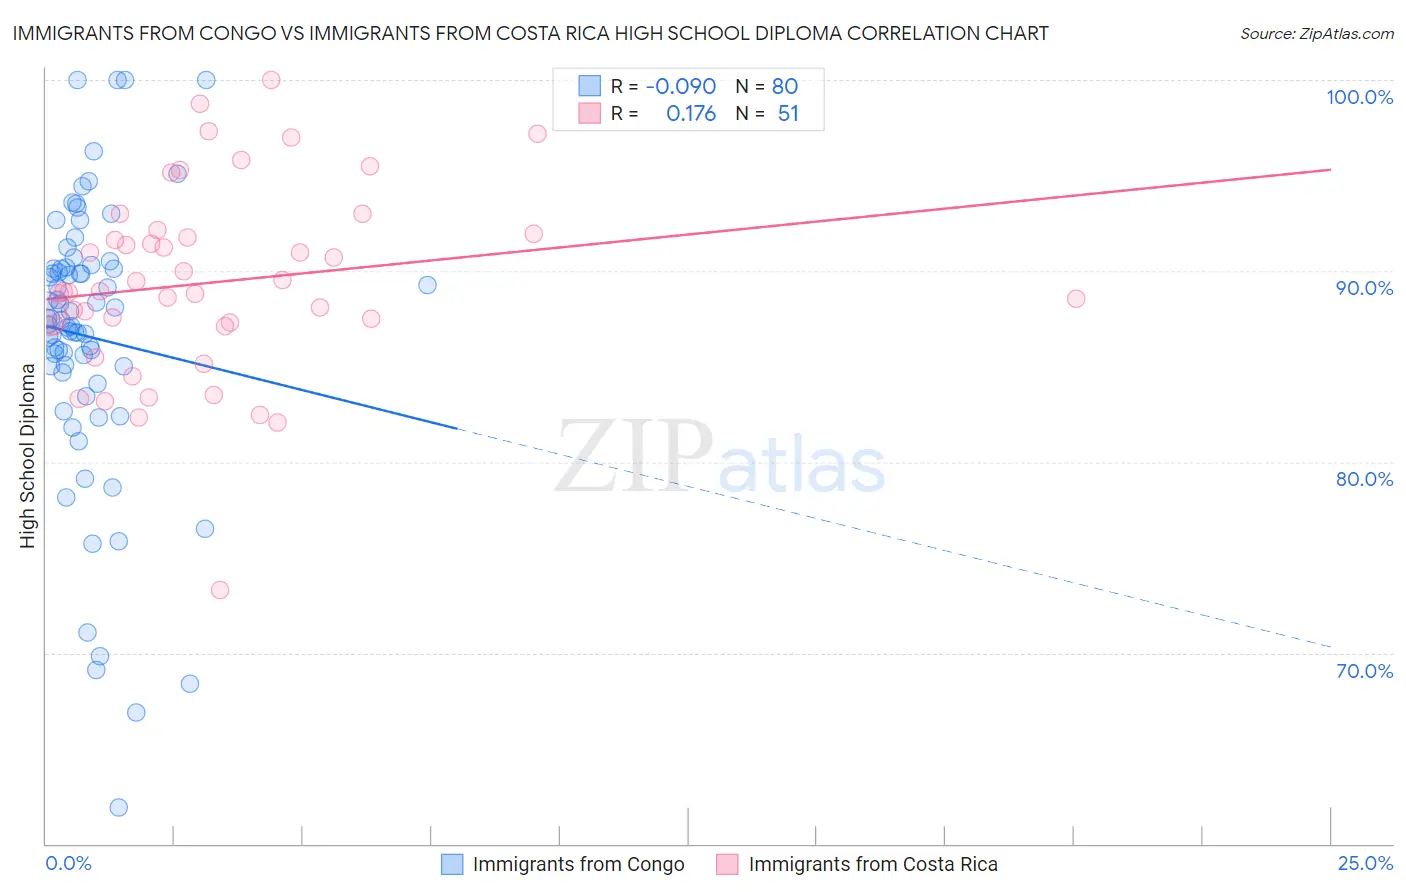
Immigrants from Congo vs Immigrants from Costa Rica High School Diploma Correlation Chart
The statistical analysis conducted on geographies consisting of 92,134,351 people shows a slight negative correlation between the proportion of Immigrants from Congo and percentage of population with at least high school diploma education in the United States with a correlation coefficient (R) of -0.090 and weighted average of 87.0%. Similarly, the statistical analysis conducted on geographies consisting of 204,277,241 people shows a poor positive correlation between the proportion of Immigrants from Costa Rica and percentage of population with at least high school diploma education in the United States with a correlation coefficient (R) of 0.176 and weighted average of 87.8%, a difference of 0.85%.
High School Diploma Correlation Summary
| Measurement | Immigrants from Congo | Immigrants from Costa Rica |
| Minimum | 61.9% | 73.3% |
| Maximum | 100.0% | 100.0% |
| Range | 38.1% | 26.7% |
| Mean | 86.5% | 89.4% |
| Median | 87.5% | 88.9% |
| Interquartile 25% (IQ1) | 84.8% | 87.2% |
| Interquartile 75% (IQ3) | 90.2% | 92.0% |
| Interquartile Range (IQR) | 5.3% | 4.8% |
| Standard Deviation (Sample) | 7.4% | 5.0% |
| Standard Deviation (Population) | 7.4% | 4.9% |
Demographics Similar to Immigrants from Congo and Immigrants from Costa Rica by High School Diploma
In terms of high school diploma, the demographic groups most similar to Immigrants from Congo are U.S. Virgin Islander (87.1%, a difference of 0.050%), Jamaican (87.2%, a difference of 0.19%), Immigrants from South Eastern Asia (87.2%, a difference of 0.21%), Immigrants from Peru (87.3%, a difference of 0.24%), and Seminole (87.3%, a difference of 0.27%). Similarly, the demographic groups most similar to Immigrants from Costa Rica are Immigrants from Eritrea (87.8%, a difference of 0.0%), Spanish American (87.7%, a difference of 0.040%), Senegalese (87.7%, a difference of 0.050%), Immigrants from Nigeria (87.7%, a difference of 0.050%), and Ghanaian (87.7%, a difference of 0.090%).
| Demographics | Rating | Rank | High School Diploma |
| Immigrants | Eritrea | 1.7 /100 | #246 | Tragic 87.8% |
| Immigrants | Costa Rica | 1.7 /100 | #247 | Tragic 87.8% |
| Spanish Americans | 1.5 /100 | #248 | Tragic 87.7% |
| Senegalese | 1.5 /100 | #249 | Tragic 87.7% |
| Immigrants | Nigeria | 1.5 /100 | #250 | Tragic 87.7% |
| Ghanaians | 1.4 /100 | #251 | Tragic 87.7% |
| Immigrants | South America | 1.2 /100 | #252 | Tragic 87.6% |
| Immigrants | Uruguay | 1.0 /100 | #253 | Tragic 87.6% |
| Immigrants | Colombia | 1.0 /100 | #254 | Tragic 87.6% |
| Immigrants | Senegal | 0.9 /100 | #255 | Tragic 87.6% |
| Africans | 0.7 /100 | #256 | Tragic 87.5% |
| Bahamians | 0.7 /100 | #257 | Tragic 87.5% |
| Immigrants | Ghana | 0.5 /100 | #258 | Tragic 87.4% |
| Immigrants | Western Africa | 0.5 /100 | #259 | Tragic 87.4% |
| Cajuns | 0.4 /100 | #260 | Tragic 87.3% |
| Seminole | 0.4 /100 | #261 | Tragic 87.3% |
| Immigrants | Peru | 0.4 /100 | #262 | Tragic 87.3% |
| Immigrants | South Eastern Asia | 0.3 /100 | #263 | Tragic 87.2% |
| Jamaicans | 0.3 /100 | #264 | Tragic 87.2% |
| U.S. Virgin Islanders | 0.2 /100 | #265 | Tragic 87.1% |
| Immigrants | Congo | 0.2 /100 | #266 | Tragic 87.0% |