Immigrants from Congo vs Houma Per Capita Income
COMPARE
Immigrants from Congo
Houma
Per Capita Income
Per Capita Income Comparison
Immigrants from Congo
Houma
$35,720
PER CAPITA INCOME
0.0/ 100
METRIC RATING
319th/ 347
METRIC RANK
$32,996
PER CAPITA INCOME
0.0/ 100
METRIC RATING
337th/ 347
METRIC RANK
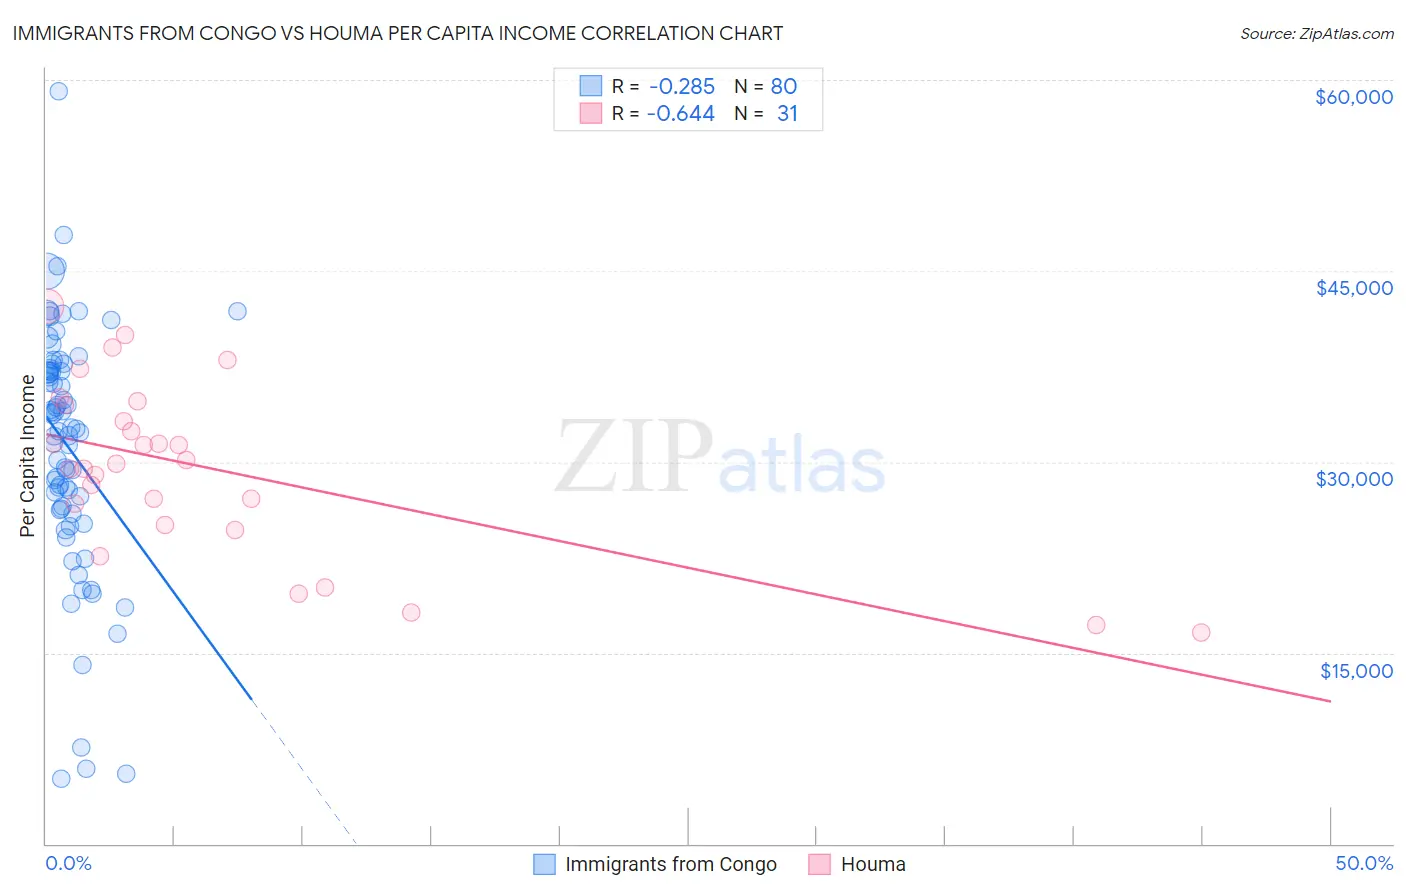
Immigrants from Congo vs Houma Per Capita Income Correlation Chart
The statistical analysis conducted on geographies consisting of 92,126,617 people shows a weak negative correlation between the proportion of Immigrants from Congo and per capita income in the United States with a correlation coefficient (R) of -0.285 and weighted average of $35,720. Similarly, the statistical analysis conducted on geographies consisting of 36,799,095 people shows a significant negative correlation between the proportion of Houma and per capita income in the United States with a correlation coefficient (R) of -0.644 and weighted average of $32,996, a difference of 8.3%.
Per Capita Income Correlation Summary
| Measurement | Immigrants from Congo | Houma |
| Minimum | $5,075 | $16,626 |
| Maximum | $59,125 | $42,187 |
| Range | $54,050 | $25,561 |
| Mean | $31,172 | $29,455 |
| Median | $32,475 | $29,877 |
| Interquartile 25% (IQ1) | $26,293 | $25,090 |
| Interquartile 75% (IQ3) | $37,243 | $34,460 |
| Interquartile Range (IQR) | $10,950 | $9,370 |
| Standard Deviation (Sample) | $9,699 | $6,714 |
| Standard Deviation (Population) | $9,639 | $6,604 |
Demographics Similar to Immigrants from Congo and Houma by Per Capita Income
In terms of per capita income, the demographic groups most similar to Immigrants from Congo are Hispanic or Latino ($35,688, a difference of 0.090%), Black/African American ($35,564, a difference of 0.44%), Creek ($35,546, a difference of 0.49%), Bangladeshi ($35,897, a difference of 0.50%), and Cheyenne ($35,276, a difference of 1.3%). Similarly, the demographic groups most similar to Houma are Yakama ($33,009, a difference of 0.040%), Yuman ($33,236, a difference of 0.73%), Native/Alaskan ($33,279, a difference of 0.86%), Arapaho ($32,345, a difference of 2.0%), and Immigrants from Yemen ($33,696, a difference of 2.1%).
| Demographics | Rating | Rank | Per Capita Income |
| Bangladeshis | 0.0 /100 | #318 | Tragic $35,897 |
| Immigrants | Congo | 0.0 /100 | #319 | Tragic $35,720 |
| Hispanics or Latinos | 0.0 /100 | #320 | Tragic $35,688 |
| Blacks/African Americans | 0.0 /100 | #321 | Tragic $35,564 |
| Creek | 0.0 /100 | #322 | Tragic $35,546 |
| Cheyenne | 0.0 /100 | #323 | Tragic $35,276 |
| Kiowa | 0.0 /100 | #324 | Tragic $35,102 |
| Immigrants | Central America | 0.0 /100 | #325 | Tragic $34,974 |
| Immigrants | Cuba | 0.0 /100 | #326 | Tragic $34,910 |
| Apache | 0.0 /100 | #327 | Tragic $34,886 |
| Menominee | 0.0 /100 | #328 | Tragic $34,578 |
| Mexicans | 0.0 /100 | #329 | Tragic $34,559 |
| Spanish American Indians | 0.0 /100 | #330 | Tragic $34,195 |
| Immigrants | Mexico | 0.0 /100 | #331 | Tragic $33,931 |
| Sioux | 0.0 /100 | #332 | Tragic $33,921 |
| Immigrants | Yemen | 0.0 /100 | #333 | Tragic $33,696 |
| Natives/Alaskans | 0.0 /100 | #334 | Tragic $33,279 |
| Yuman | 0.0 /100 | #335 | Tragic $33,236 |
| Yakama | 0.0 /100 | #336 | Tragic $33,009 |
| Houma | 0.0 /100 | #337 | Tragic $32,996 |
| Arapaho | 0.0 /100 | #338 | Tragic $32,345 |