Immigrants from Colombia vs Immigrants from South Central Asia Per Capita Income
COMPARE
Immigrants from Colombia
Immigrants from South Central Asia
Per Capita Income
Per Capita Income Comparison
Immigrants from Colombia
Immigrants from South Central Asia
$42,971
PER CAPITA INCOME
31.5/ 100
METRIC RATING
187th/ 347
METRIC RANK
$52,660
PER CAPITA INCOME
100.0/ 100
METRIC RATING
27th/ 347
METRIC RANK
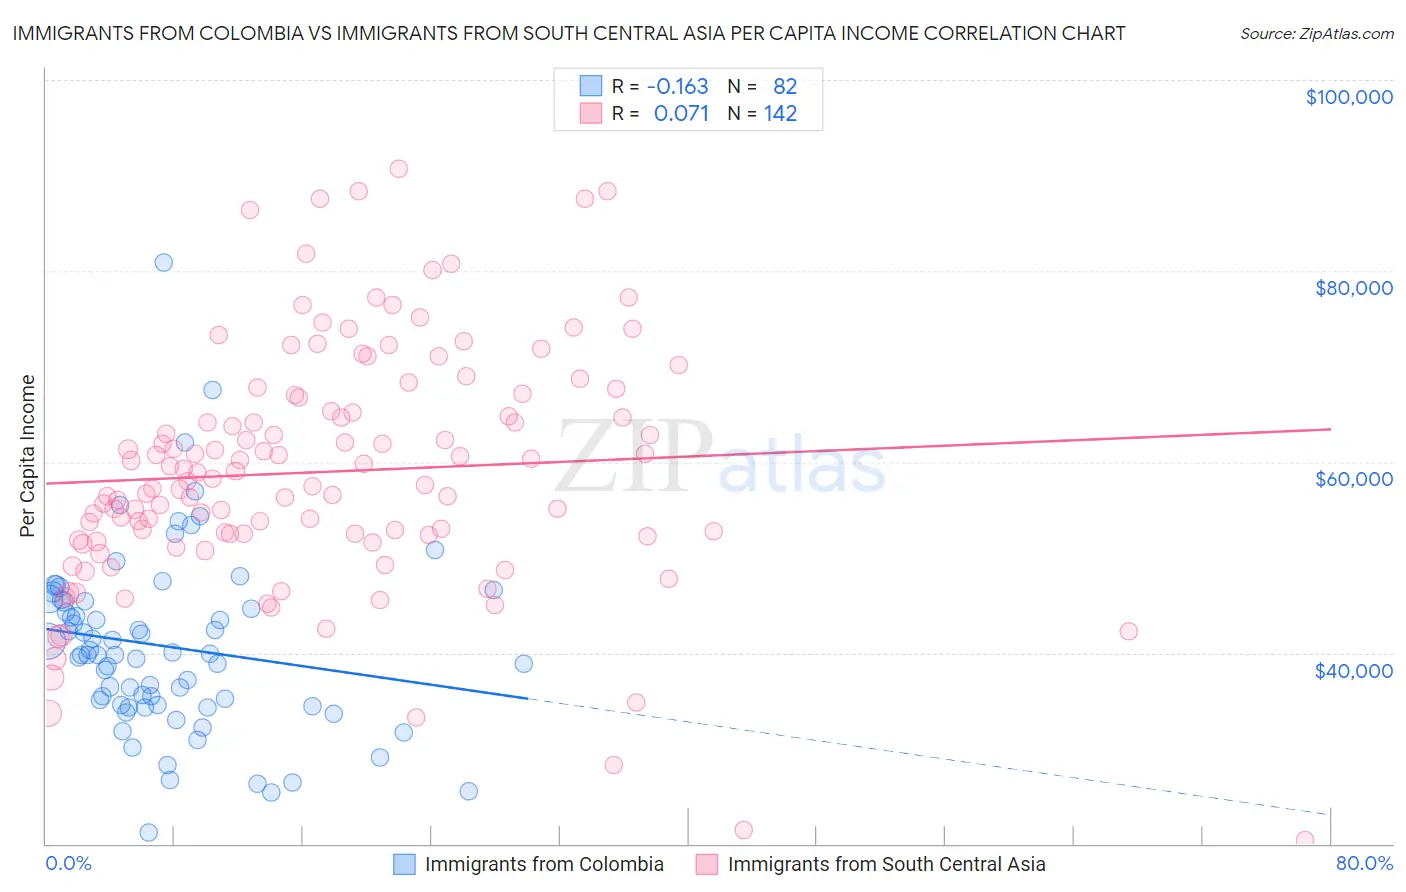
Immigrants from Colombia vs Immigrants from South Central Asia Per Capita Income Correlation Chart
The statistical analysis conducted on geographies consisting of 378,698,677 people shows a poor negative correlation between the proportion of Immigrants from Colombia and per capita income in the United States with a correlation coefficient (R) of -0.163 and weighted average of $42,971. Similarly, the statistical analysis conducted on geographies consisting of 473,150,606 people shows a slight positive correlation between the proportion of Immigrants from South Central Asia and per capita income in the United States with a correlation coefficient (R) of 0.071 and weighted average of $52,660, a difference of 22.6%.
Per Capita Income Correlation Summary
| Measurement | Immigrants from Colombia | Immigrants from South Central Asia |
| Minimum | $21,139 | $20,428 |
| Maximum | $80,934 | $90,751 |
| Range | $59,795 | $70,323 |
| Mean | $40,659 | $58,959 |
| Median | $39,822 | $58,134 |
| Interquartile 25% (IQ1) | $34,523 | $52,199 |
| Interquartile 75% (IQ3) | $45,376 | $66,712 |
| Interquartile Range (IQR) | $10,853 | $14,513 |
| Standard Deviation (Sample) | $9,573 | $12,766 |
| Standard Deviation (Population) | $9,515 | $12,721 |
Similar Demographics by Per Capita Income
Demographics Similar to Immigrants from Colombia by Per Capita Income
In terms of per capita income, the demographic groups most similar to Immigrants from Colombia are Immigrants from Africa ($42,950, a difference of 0.050%), French Canadian ($43,003, a difference of 0.070%), Immigrants ($43,010, a difference of 0.090%), Spaniard ($43,028, a difference of 0.13%), and Bermudan ($42,911, a difference of 0.14%).
| Demographics | Rating | Rank | Per Capita Income |
| Sierra Leoneans | 42.9 /100 | #180 | Average $43,405 |
| Welsh | 38.2 /100 | #181 | Fair $43,233 |
| Immigrants | Vietnam | 38.1 /100 | #182 | Fair $43,229 |
| Germans | 33.9 /100 | #183 | Fair $43,067 |
| Spaniards | 32.9 /100 | #184 | Fair $43,028 |
| Immigrants | Immigrants | 32.5 /100 | #185 | Fair $43,010 |
| French Canadians | 32.3 /100 | #186 | Fair $43,003 |
| Immigrants | Colombia | 31.5 /100 | #187 | Fair $42,971 |
| Immigrants | Africa | 31.0 /100 | #188 | Fair $42,950 |
| Bermudans | 30.1 /100 | #189 | Fair $42,911 |
| Kenyans | 27.7 /100 | #190 | Fair $42,808 |
| Yugoslavians | 27.4 /100 | #191 | Fair $42,792 |
| Iraqis | 26.7 /100 | #192 | Fair $42,760 |
| Immigrants | Sierra Leone | 26.5 /100 | #193 | Fair $42,752 |
| Immigrants | Fiji | 25.2 /100 | #194 | Fair $42,694 |
Demographics Similar to Immigrants from South Central Asia by Per Capita Income
In terms of per capita income, the demographic groups most similar to Immigrants from South Central Asia are Latvian ($52,649, a difference of 0.020%), Israeli ($52,596, a difference of 0.12%), Immigrants from Austria ($52,503, a difference of 0.30%), Turkish ($52,391, a difference of 0.51%), and Immigrants from Norway ($52,217, a difference of 0.85%).
| Demographics | Rating | Rank | Per Capita Income |
| Soviet Union | 100.0 /100 | #20 | Exceptional $54,202 |
| Immigrants | Northern Europe | 100.0 /100 | #21 | Exceptional $54,159 |
| Indians (Asian) | 100.0 /100 | #22 | Exceptional $53,874 |
| Immigrants | Eastern Asia | 100.0 /100 | #23 | Exceptional $53,806 |
| Immigrants | Denmark | 100.0 /100 | #24 | Exceptional $53,799 |
| Immigrants | Japan | 100.0 /100 | #25 | Exceptional $53,359 |
| Russians | 100.0 /100 | #26 | Exceptional $53,154 |
| Immigrants | South Central Asia | 100.0 /100 | #27 | Exceptional $52,660 |
| Latvians | 100.0 /100 | #28 | Exceptional $52,649 |
| Israelis | 100.0 /100 | #29 | Exceptional $52,596 |
| Immigrants | Austria | 100.0 /100 | #30 | Exceptional $52,503 |
| Turks | 100.0 /100 | #31 | Exceptional $52,391 |
| Immigrants | Norway | 100.0 /100 | #32 | Exceptional $52,217 |
| Australians | 100.0 /100 | #33 | Exceptional $52,074 |
| Immigrants | Russia | 100.0 /100 | #34 | Exceptional $52,044 |