Cuban vs Polish Median Household Income
COMPARE
Cuban
Polish
Median Household Income
Median Household Income Comparison
Cubans
Poles
$73,392
MEDIAN HOUSEHOLD INCOME
0.1/ 100
METRIC RATING
295th/ 347
METRIC RANK
$88,472
MEDIAN HOUSEHOLD INCOME
89.7/ 100
METRIC RATING
136th/ 347
METRIC RANK
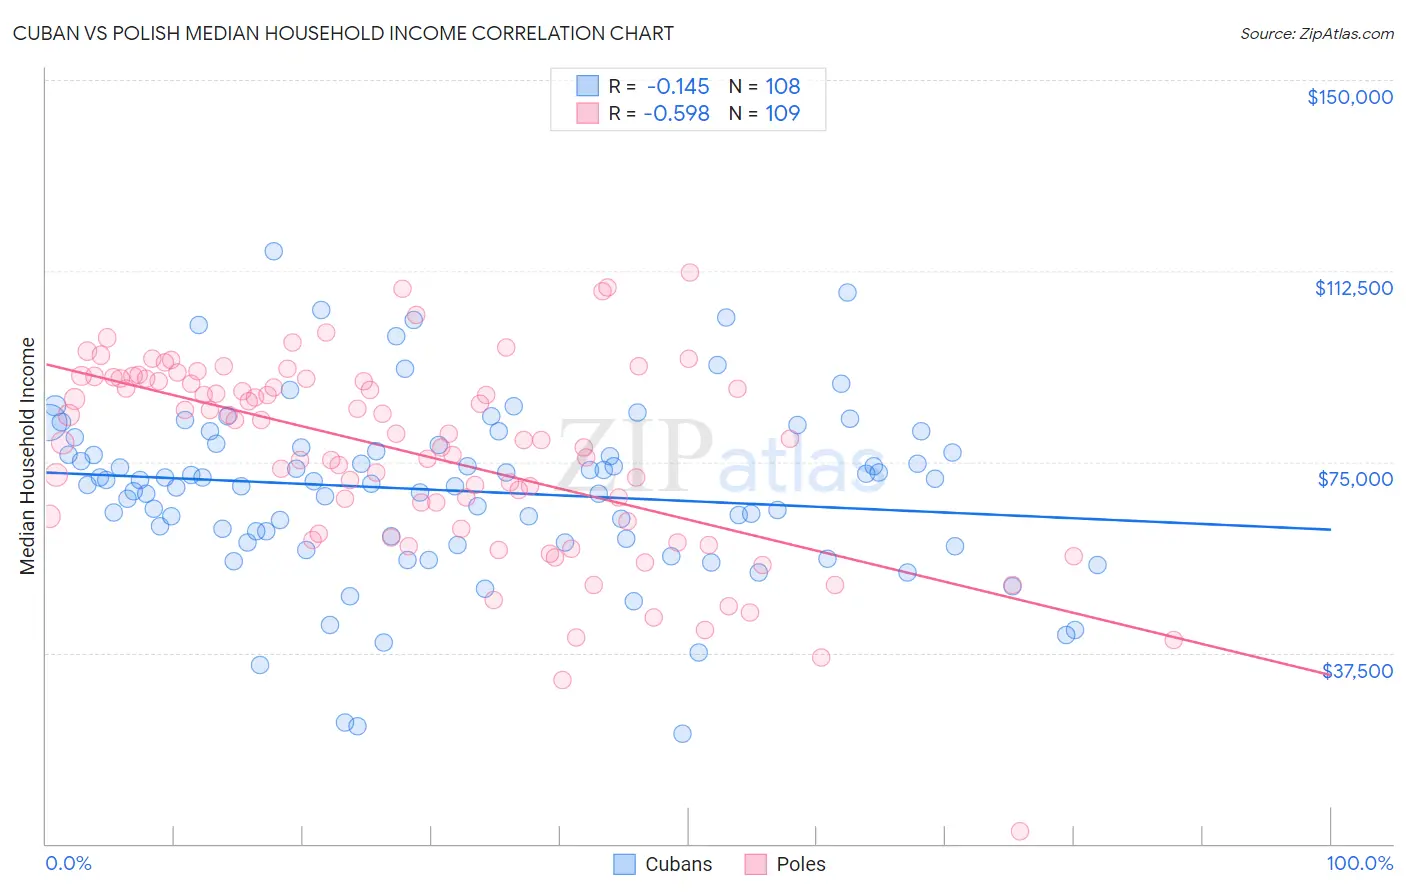
Cuban vs Polish Median Household Income Correlation Chart
The statistical analysis conducted on geographies consisting of 448,852,866 people shows a poor negative correlation between the proportion of Cubans and median household income in the United States with a correlation coefficient (R) of -0.145 and weighted average of $73,392. Similarly, the statistical analysis conducted on geographies consisting of 559,571,407 people shows a substantial negative correlation between the proportion of Poles and median household income in the United States with a correlation coefficient (R) of -0.598 and weighted average of $88,472, a difference of 20.5%.
Median Household Income Correlation Summary
| Measurement | Cuban | Polish |
| Minimum | $21,567 | $2,499 |
| Maximum | $116,431 | $112,083 |
| Range | $94,864 | $109,584 |
| Mean | $69,339 | $76,577 |
| Median | $70,955 | $79,444 |
| Interquartile 25% (IQ1) | $59,587 | $62,696 |
| Interquartile 75% (IQ3) | $78,118 | $91,347 |
| Interquartile Range (IQR) | $18,531 | $28,651 |
| Standard Deviation (Sample) | $17,087 | $19,210 |
| Standard Deviation (Population) | $17,007 | $19,121 |
Similar Demographics by Median Household Income
Demographics Similar to Cubans by Median Household Income
In terms of median household income, the demographic groups most similar to Cubans are Haitian ($73,306, a difference of 0.12%), Blackfeet ($73,509, a difference of 0.16%), Immigrants from Cabo Verde ($73,515, a difference of 0.17%), Immigrants from Mexico ($73,160, a difference of 0.32%), and Comanche ($73,747, a difference of 0.48%).
| Demographics | Rating | Rank | Median Household Income |
| Immigrants | Central America | 0.1 /100 | #288 | Tragic $74,217 |
| Fijians | 0.1 /100 | #289 | Tragic $74,205 |
| Bangladeshis | 0.1 /100 | #290 | Tragic $74,112 |
| Hispanics or Latinos | 0.1 /100 | #291 | Tragic $73,823 |
| Comanche | 0.1 /100 | #292 | Tragic $73,747 |
| Immigrants | Cabo Verde | 0.1 /100 | #293 | Tragic $73,515 |
| Blackfeet | 0.1 /100 | #294 | Tragic $73,509 |
| Cubans | 0.1 /100 | #295 | Tragic $73,392 |
| Haitians | 0.1 /100 | #296 | Tragic $73,306 |
| Immigrants | Mexico | 0.0 /100 | #297 | Tragic $73,160 |
| Paiute | 0.0 /100 | #298 | Tragic $72,959 |
| Indonesians | 0.0 /100 | #299 | Tragic $72,856 |
| Immigrants | Dominica | 0.0 /100 | #300 | Tragic $72,760 |
| Cherokee | 0.0 /100 | #301 | Tragic $72,682 |
| Shoshone | 0.0 /100 | #302 | Tragic $72,660 |
Demographics Similar to Poles by Median Household Income
In terms of median household income, the demographic groups most similar to Poles are Sierra Leonean ($88,463, a difference of 0.010%), Immigrants from Sierra Leone ($88,498, a difference of 0.030%), Swedish ($88,524, a difference of 0.060%), Arab ($88,398, a difference of 0.080%), and Immigrants from Chile ($88,388, a difference of 0.090%).
| Demographics | Rating | Rank | Median Household Income |
| Brazilians | 92.1 /100 | #129 | Exceptional $88,934 |
| British | 92.0 /100 | #130 | Exceptional $88,914 |
| Immigrants | Syria | 91.4 /100 | #131 | Exceptional $88,792 |
| Europeans | 91.2 /100 | #132 | Exceptional $88,751 |
| Immigrants | Ethiopia | 90.9 /100 | #133 | Exceptional $88,687 |
| Swedes | 90.0 /100 | #134 | Exceptional $88,524 |
| Immigrants | Sierra Leone | 89.9 /100 | #135 | Excellent $88,498 |
| Poles | 89.7 /100 | #136 | Excellent $88,472 |
| Sierra Leoneans | 89.6 /100 | #137 | Excellent $88,463 |
| Arabs | 89.2 /100 | #138 | Excellent $88,398 |
| Immigrants | Chile | 89.2 /100 | #139 | Excellent $88,388 |
| Lebanese | 87.2 /100 | #140 | Excellent $88,091 |
| Immigrants | Morocco | 86.0 /100 | #141 | Excellent $87,930 |
| Canadians | 84.7 /100 | #142 | Excellent $87,769 |
| Danes | 83.9 /100 | #143 | Excellent $87,676 |