Immigrants from Belarus vs Polish Median Household Income
COMPARE
Immigrants from Belarus
Polish
Median Household Income
Median Household Income Comparison
Immigrants from Belarus
Poles
$94,399
MEDIAN HOUSEHOLD INCOME
99.7/ 100
METRIC RATING
65th/ 347
METRIC RANK
$88,472
MEDIAN HOUSEHOLD INCOME
89.7/ 100
METRIC RATING
136th/ 347
METRIC RANK
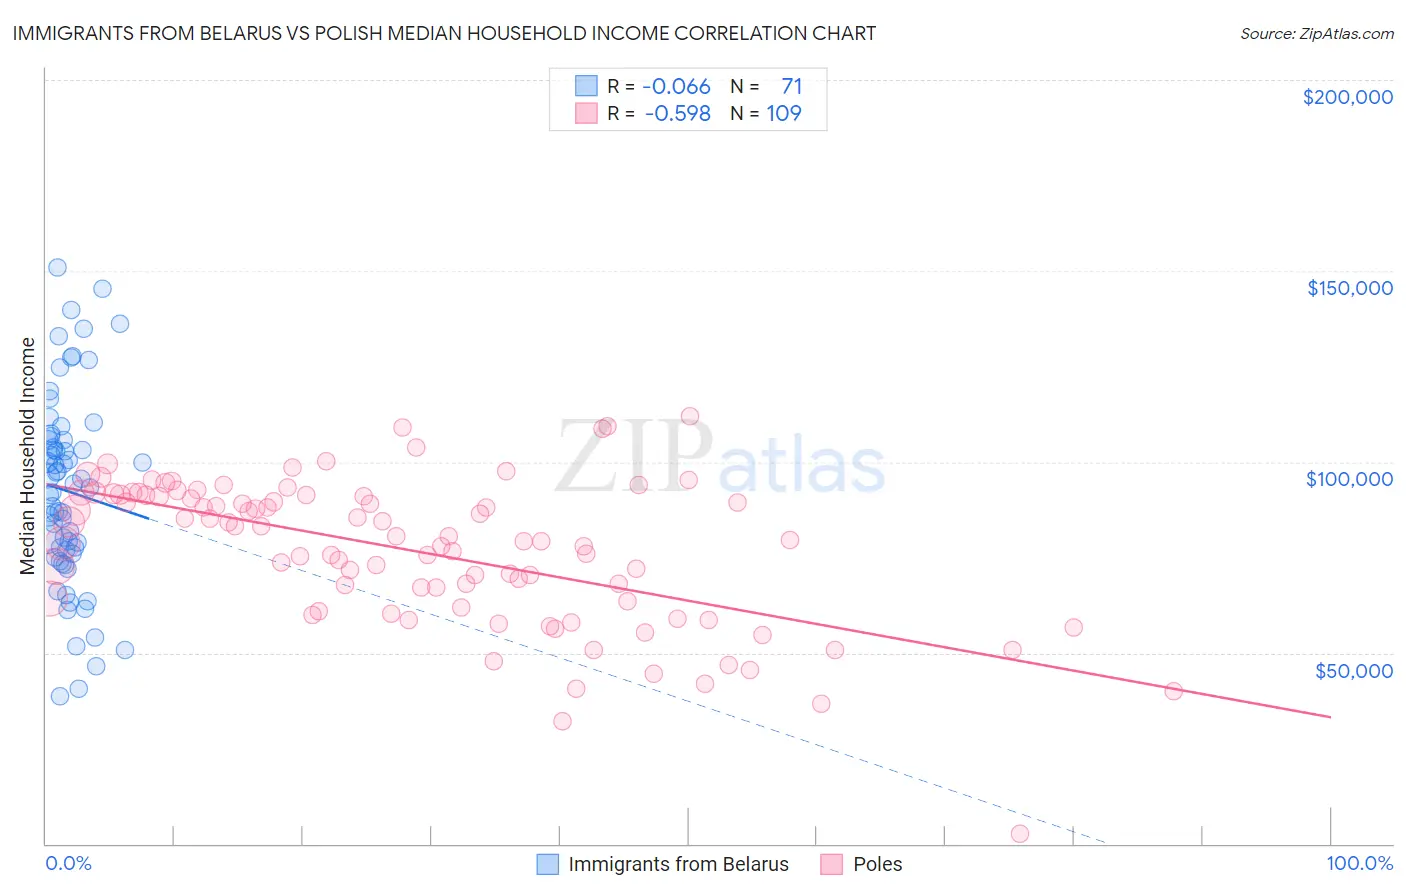
Immigrants from Belarus vs Polish Median Household Income Correlation Chart
The statistical analysis conducted on geographies consisting of 150,184,095 people shows a slight negative correlation between the proportion of Immigrants from Belarus and median household income in the United States with a correlation coefficient (R) of -0.066 and weighted average of $94,399. Similarly, the statistical analysis conducted on geographies consisting of 559,571,407 people shows a substantial negative correlation between the proportion of Poles and median household income in the United States with a correlation coefficient (R) of -0.598 and weighted average of $88,472, a difference of 6.7%.
Median Household Income Correlation Summary
| Measurement | Immigrants from Belarus | Polish |
| Minimum | $38,670 | $2,499 |
| Maximum | $150,801 | $112,083 |
| Range | $112,131 | $109,584 |
| Mean | $92,306 | $76,577 |
| Median | $93,264 | $79,444 |
| Interquartile 25% (IQ1) | $75,784 | $62,696 |
| Interquartile 75% (IQ3) | $105,707 | $91,347 |
| Interquartile Range (IQR) | $29,923 | $28,651 |
| Standard Deviation (Sample) | $25,053 | $19,210 |
| Standard Deviation (Population) | $24,876 | $19,121 |
Similar Demographics by Median Household Income
Demographics Similar to Immigrants from Belarus by Median Household Income
In terms of median household income, the demographic groups most similar to Immigrants from Belarus are Immigrants from Netherlands ($94,411, a difference of 0.010%), Immigrants from Romania ($94,222, a difference of 0.19%), Immigrants from Scotland ($94,091, a difference of 0.33%), Greek ($94,735, a difference of 0.36%), and Mongolian ($93,971, a difference of 0.46%).
| Demographics | Rating | Rank | Median Household Income |
| Soviet Union | 99.8 /100 | #58 | Exceptional $95,098 |
| Immigrants | Europe | 99.8 /100 | #59 | Exceptional $95,032 |
| Koreans | 99.8 /100 | #60 | Exceptional $95,018 |
| Laotians | 99.8 /100 | #61 | Exceptional $94,990 |
| Immigrants | Norway | 99.8 /100 | #62 | Exceptional $94,846 |
| Greeks | 99.8 /100 | #63 | Exceptional $94,735 |
| Immigrants | Netherlands | 99.7 /100 | #64 | Exceptional $94,411 |
| Immigrants | Belarus | 99.7 /100 | #65 | Exceptional $94,399 |
| Immigrants | Romania | 99.7 /100 | #66 | Exceptional $94,222 |
| Immigrants | Scotland | 99.7 /100 | #67 | Exceptional $94,091 |
| Mongolians | 99.7 /100 | #68 | Exceptional $93,971 |
| Argentineans | 99.7 /100 | #69 | Exceptional $93,960 |
| Immigrants | Fiji | 99.7 /100 | #70 | Exceptional $93,933 |
| Immigrants | Philippines | 99.6 /100 | #71 | Exceptional $93,899 |
| Lithuanians | 99.6 /100 | #72 | Exceptional $93,852 |
Demographics Similar to Poles by Median Household Income
In terms of median household income, the demographic groups most similar to Poles are Sierra Leonean ($88,463, a difference of 0.010%), Immigrants from Sierra Leone ($88,498, a difference of 0.030%), Swedish ($88,524, a difference of 0.060%), Arab ($88,398, a difference of 0.080%), and Immigrants from Chile ($88,388, a difference of 0.090%).
| Demographics | Rating | Rank | Median Household Income |
| Brazilians | 92.1 /100 | #129 | Exceptional $88,934 |
| British | 92.0 /100 | #130 | Exceptional $88,914 |
| Immigrants | Syria | 91.4 /100 | #131 | Exceptional $88,792 |
| Europeans | 91.2 /100 | #132 | Exceptional $88,751 |
| Immigrants | Ethiopia | 90.9 /100 | #133 | Exceptional $88,687 |
| Swedes | 90.0 /100 | #134 | Exceptional $88,524 |
| Immigrants | Sierra Leone | 89.9 /100 | #135 | Excellent $88,498 |
| Poles | 89.7 /100 | #136 | Excellent $88,472 |
| Sierra Leoneans | 89.6 /100 | #137 | Excellent $88,463 |
| Arabs | 89.2 /100 | #138 | Excellent $88,398 |
| Immigrants | Chile | 89.2 /100 | #139 | Excellent $88,388 |
| Lebanese | 87.2 /100 | #140 | Excellent $88,091 |
| Immigrants | Morocco | 86.0 /100 | #141 | Excellent $87,930 |
| Canadians | 84.7 /100 | #142 | Excellent $87,769 |
| Danes | 83.9 /100 | #143 | Excellent $87,676 |