Immigrants from Central America vs Venezuelan Median Earnings
COMPARE
Immigrants from Central America
Venezuelan
Median Earnings
Median Earnings Comparison
Immigrants from Central America
Venezuelans
$39,762
MEDIAN EARNINGS
0.0/ 100
METRIC RATING
322nd/ 347
METRIC RANK
$44,580
MEDIAN EARNINGS
6.9/ 100
METRIC RATING
235th/ 347
METRIC RANK
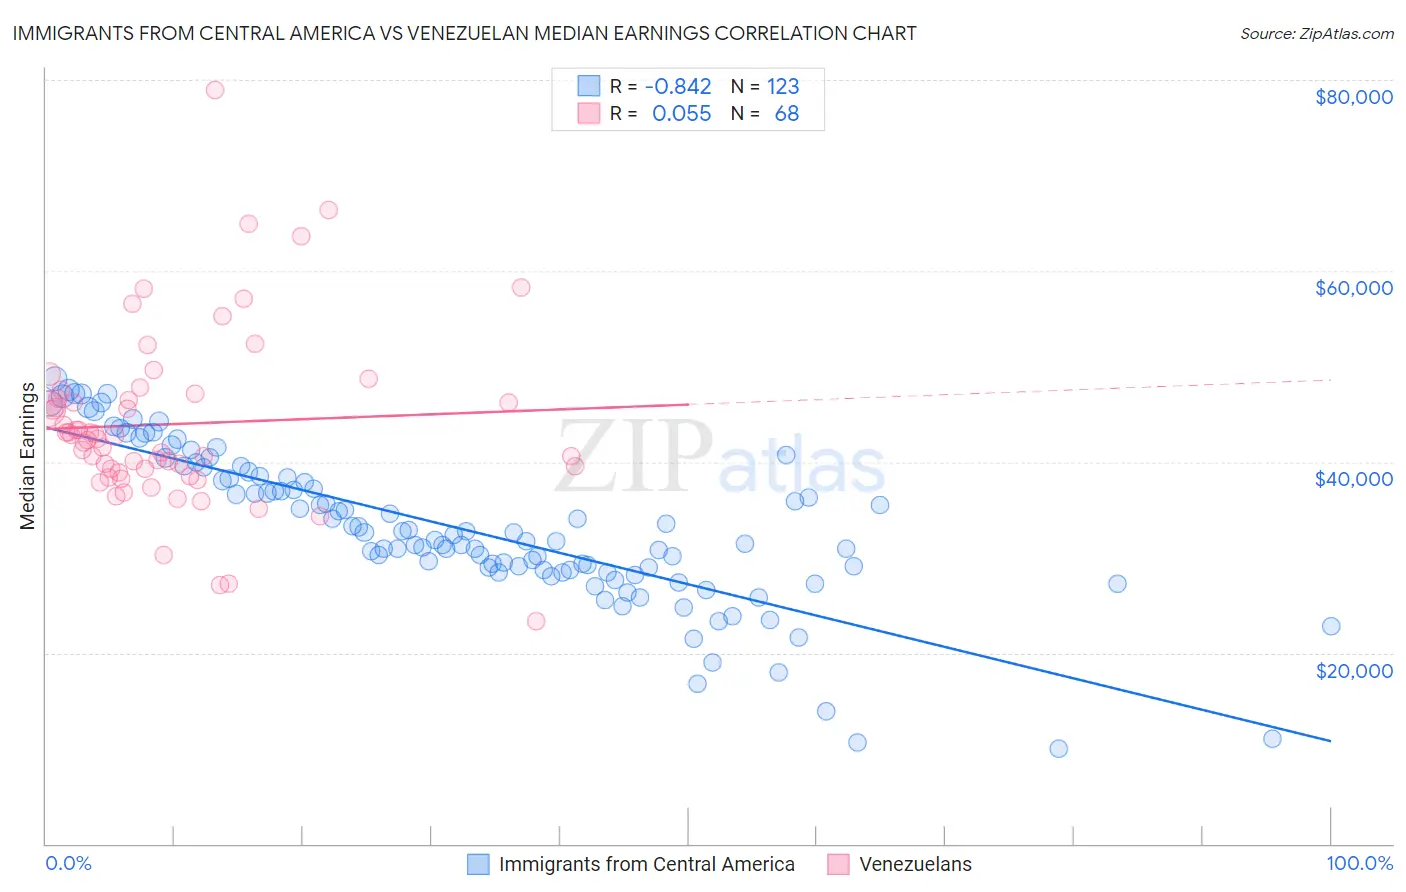
Immigrants from Central America vs Venezuelan Median Earnings Correlation Chart
The statistical analysis conducted on geographies consisting of 536,322,180 people shows a very strong negative correlation between the proportion of Immigrants from Central America and median earnings in the United States with a correlation coefficient (R) of -0.842 and weighted average of $39,762. Similarly, the statistical analysis conducted on geographies consisting of 306,328,741 people shows a slight positive correlation between the proportion of Venezuelans and median earnings in the United States with a correlation coefficient (R) of 0.055 and weighted average of $44,580, a difference of 12.1%.
Median Earnings Correlation Summary
| Measurement | Immigrants from Central America | Venezuelan |
| Minimum | $9,917 | $23,314 |
| Maximum | $48,696 | $78,969 |
| Range | $38,779 | $55,655 |
| Mean | $33,043 | $43,969 |
| Median | $32,380 | $42,571 |
| Interquartile 25% (IQ1) | $28,620 | $39,048 |
| Interquartile 75% (IQ3) | $38,496 | $46,866 |
| Interquartile Range (IQR) | $9,875 | $7,818 |
| Standard Deviation (Sample) | $8,045 | $9,261 |
| Standard Deviation (Population) | $8,012 | $9,192 |
Similar Demographics by Median Earnings
Demographics Similar to Immigrants from Central America by Median Earnings
In terms of median earnings, the demographic groups most similar to Immigrants from Central America are Bahamian ($39,735, a difference of 0.070%), Ottawa ($39,721, a difference of 0.10%), Mexican ($39,834, a difference of 0.18%), Immigrants from Bahamas ($39,861, a difference of 0.25%), and Creek ($39,648, a difference of 0.29%).
| Demographics | Rating | Rank | Median Earnings |
| Seminole | 0.0 /100 | #315 | Tragic $40,233 |
| Immigrants | Honduras | 0.0 /100 | #316 | Tragic $40,195 |
| Fijians | 0.0 /100 | #317 | Tragic $40,193 |
| Dutch West Indians | 0.0 /100 | #318 | Tragic $40,107 |
| Blacks/African Americans | 0.0 /100 | #319 | Tragic $40,085 |
| Immigrants | Bahamas | 0.0 /100 | #320 | Tragic $39,861 |
| Mexicans | 0.0 /100 | #321 | Tragic $39,834 |
| Immigrants | Central America | 0.0 /100 | #322 | Tragic $39,762 |
| Bahamians | 0.0 /100 | #323 | Tragic $39,735 |
| Ottawa | 0.0 /100 | #324 | Tragic $39,721 |
| Creek | 0.0 /100 | #325 | Tragic $39,648 |
| Immigrants | Yemen | 0.0 /100 | #326 | Tragic $39,540 |
| Yuman | 0.0 /100 | #327 | Tragic $39,523 |
| Sioux | 0.0 /100 | #328 | Tragic $39,448 |
| Kiowa | 0.0 /100 | #329 | Tragic $39,232 |
Demographics Similar to Venezuelans by Median Earnings
In terms of median earnings, the demographic groups most similar to Venezuelans are British West Indian ($44,552, a difference of 0.060%), Cape Verdean ($44,640, a difference of 0.14%), Immigrants from Ecuador ($44,462, a difference of 0.27%), Sudanese ($44,419, a difference of 0.36%), and Immigrants from Sudan ($44,767, a difference of 0.42%).
| Demographics | Rating | Rank | Median Earnings |
| Immigrants | Iraq | 11.6 /100 | #228 | Poor $44,988 |
| Scotch-Irish | 10.7 /100 | #229 | Poor $44,924 |
| Immigrants | Western Africa | 10.3 /100 | #230 | Poor $44,893 |
| Japanese | 9.5 /100 | #231 | Tragic $44,825 |
| Delaware | 9.0 /100 | #232 | Tragic $44,783 |
| Immigrants | Sudan | 8.8 /100 | #233 | Tragic $44,767 |
| Cape Verdeans | 7.5 /100 | #234 | Tragic $44,640 |
| Venezuelans | 6.9 /100 | #235 | Tragic $44,580 |
| British West Indians | 6.7 /100 | #236 | Tragic $44,552 |
| Immigrants | Ecuador | 5.9 /100 | #237 | Tragic $44,462 |
| Sudanese | 5.6 /100 | #238 | Tragic $44,419 |
| Senegalese | 5.3 /100 | #239 | Tragic $44,373 |
| Aleuts | 4.4 /100 | #240 | Tragic $44,241 |
| Samoans | 4.2 /100 | #241 | Tragic $44,206 |
| Immigrants | Venezuela | 4.0 /100 | #242 | Tragic $44,163 |