Immigrants from Caribbean vs Cajun Median Earnings
COMPARE
Immigrants from Caribbean
Cajun
Median Earnings
Median Earnings Comparison
Immigrants from Caribbean
Cajuns
$41,119
MEDIAN EARNINGS
0.1/ 100
METRIC RATING
299th/ 347
METRIC RANK
$42,189
MEDIAN EARNINGS
0.3/ 100
METRIC RATING
278th/ 347
METRIC RANK
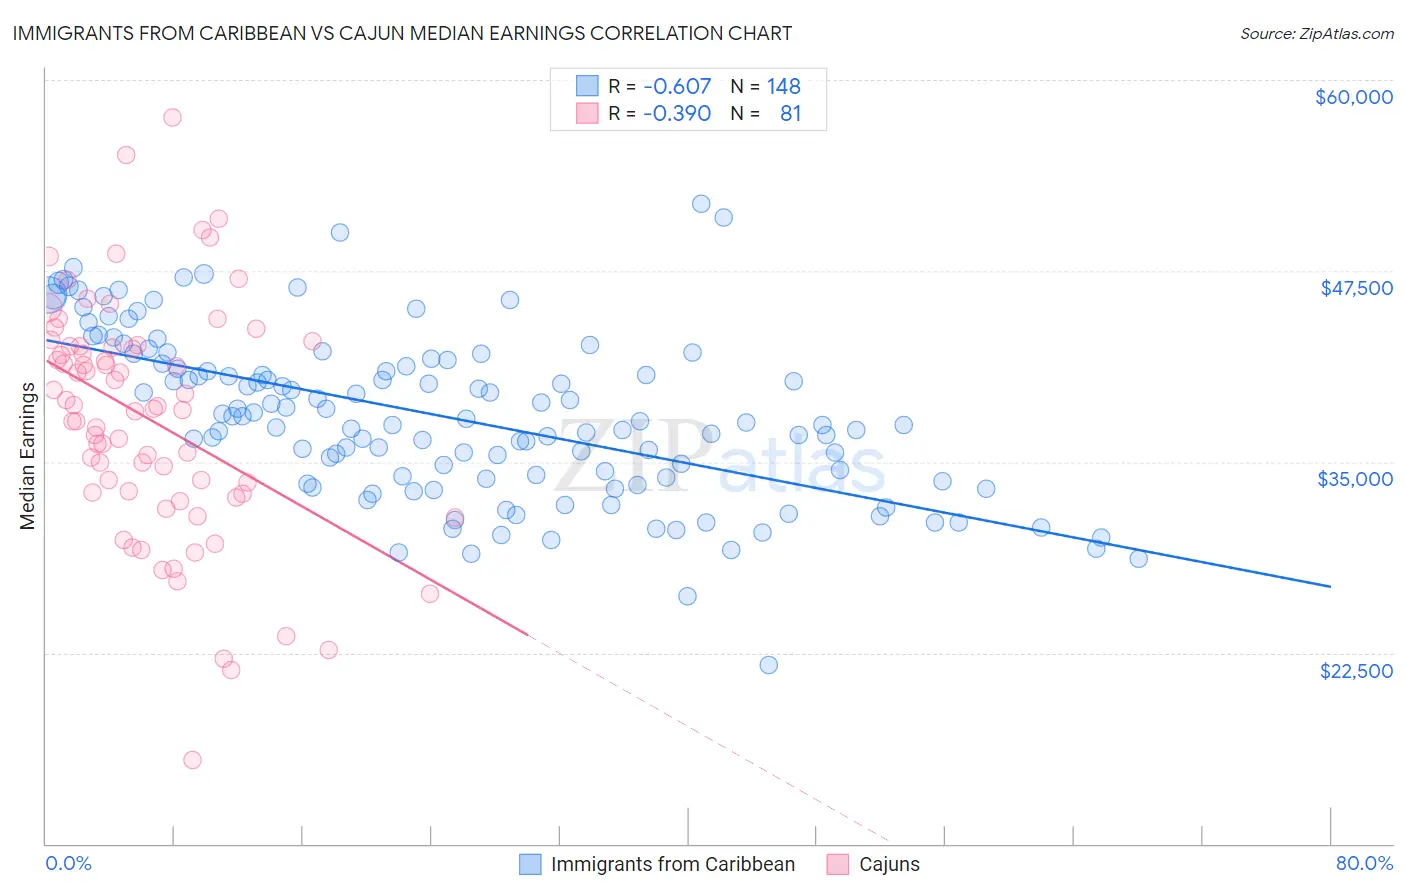
Immigrants from Caribbean vs Cajun Median Earnings Correlation Chart
The statistical analysis conducted on geographies consisting of 450,013,484 people shows a significant negative correlation between the proportion of Immigrants from Caribbean and median earnings in the United States with a correlation coefficient (R) of -0.607 and weighted average of $41,119. Similarly, the statistical analysis conducted on geographies consisting of 149,692,940 people shows a mild negative correlation between the proportion of Cajuns and median earnings in the United States with a correlation coefficient (R) of -0.390 and weighted average of $42,189, a difference of 2.6%.
Median Earnings Correlation Summary
| Measurement | Immigrants from Caribbean | Cajun |
| Minimum | $21,741 | $15,451 |
| Maximum | $51,911 | $57,514 |
| Range | $30,170 | $42,063 |
| Mean | $37,958 | $37,817 |
| Median | $37,629 | $38,499 |
| Interquartile 25% (IQ1) | $33,921 | $32,952 |
| Interquartile 75% (IQ3) | $41,541 | $42,585 |
| Interquartile Range (IQR) | $7,620 | $9,633 |
| Standard Deviation (Sample) | $5,439 | $7,734 |
| Standard Deviation (Population) | $5,421 | $7,686 |
Similar Demographics by Median Earnings
Demographics Similar to Immigrants from Caribbean by Median Earnings
In terms of median earnings, the demographic groups most similar to Immigrants from Caribbean are Immigrants from Micronesia ($41,133, a difference of 0.030%), Ute ($41,051, a difference of 0.17%), Immigrants from Latin America ($41,049, a difference of 0.17%), Guatemalan ($41,205, a difference of 0.21%), and Cherokee ($41,252, a difference of 0.32%).
| Demographics | Rating | Rank | Median Earnings |
| U.S. Virgin Islanders | 0.1 /100 | #292 | Tragic $41,448 |
| Immigrants | Zaire | 0.1 /100 | #293 | Tragic $41,325 |
| Potawatomi | 0.1 /100 | #294 | Tragic $41,288 |
| Bangladeshis | 0.1 /100 | #295 | Tragic $41,263 |
| Cherokee | 0.1 /100 | #296 | Tragic $41,252 |
| Guatemalans | 0.1 /100 | #297 | Tragic $41,205 |
| Immigrants | Micronesia | 0.1 /100 | #298 | Tragic $41,133 |
| Immigrants | Caribbean | 0.1 /100 | #299 | Tragic $41,119 |
| Ute | 0.1 /100 | #300 | Tragic $41,051 |
| Immigrants | Latin America | 0.1 /100 | #301 | Tragic $41,049 |
| Shoshone | 0.0 /100 | #302 | Tragic $40,932 |
| Haitians | 0.0 /100 | #303 | Tragic $40,918 |
| Immigrants | Guatemala | 0.0 /100 | #304 | Tragic $40,851 |
| Chickasaw | 0.0 /100 | #305 | Tragic $40,672 |
| Yaqui | 0.0 /100 | #306 | Tragic $40,647 |
Demographics Similar to Cajuns by Median Earnings
In terms of median earnings, the demographic groups most similar to Cajuns are Colville ($42,151, a difference of 0.090%), Hmong ($42,111, a difference of 0.19%), Central American ($42,280, a difference of 0.21%), Spanish American ($42,316, a difference of 0.30%), and Immigrants from Belize ($42,339, a difference of 0.36%).
| Demographics | Rating | Rank | Median Earnings |
| Pennsylvania Germans | 0.5 /100 | #271 | Tragic $42,615 |
| Iroquois | 0.4 /100 | #272 | Tragic $42,430 |
| Immigrants | Dominica | 0.4 /100 | #273 | Tragic $42,420 |
| Immigrants | El Salvador | 0.4 /100 | #274 | Tragic $42,413 |
| Immigrants | Belize | 0.3 /100 | #275 | Tragic $42,339 |
| Spanish Americans | 0.3 /100 | #276 | Tragic $42,316 |
| Central Americans | 0.3 /100 | #277 | Tragic $42,280 |
| Cajuns | 0.3 /100 | #278 | Tragic $42,189 |
| Colville | 0.2 /100 | #279 | Tragic $42,151 |
| Hmong | 0.2 /100 | #280 | Tragic $42,111 |
| Marshallese | 0.2 /100 | #281 | Tragic $41,969 |
| Africans | 0.2 /100 | #282 | Tragic $41,955 |
| Dominicans | 0.2 /100 | #283 | Tragic $41,864 |
| Blackfeet | 0.2 /100 | #284 | Tragic $41,822 |
| Immigrants | Nicaragua | 0.1 /100 | #285 | Tragic $41,737 |