Immigrants from Caribbean vs Immigrants from Central America Median Earnings
COMPARE
Immigrants from Caribbean
Immigrants from Central America
Median Earnings
Median Earnings Comparison
Immigrants from Caribbean
Immigrants from Central America
$41,119
MEDIAN EARNINGS
0.1/ 100
METRIC RATING
299th/ 347
METRIC RANK
$39,762
MEDIAN EARNINGS
0.0/ 100
METRIC RATING
322nd/ 347
METRIC RANK
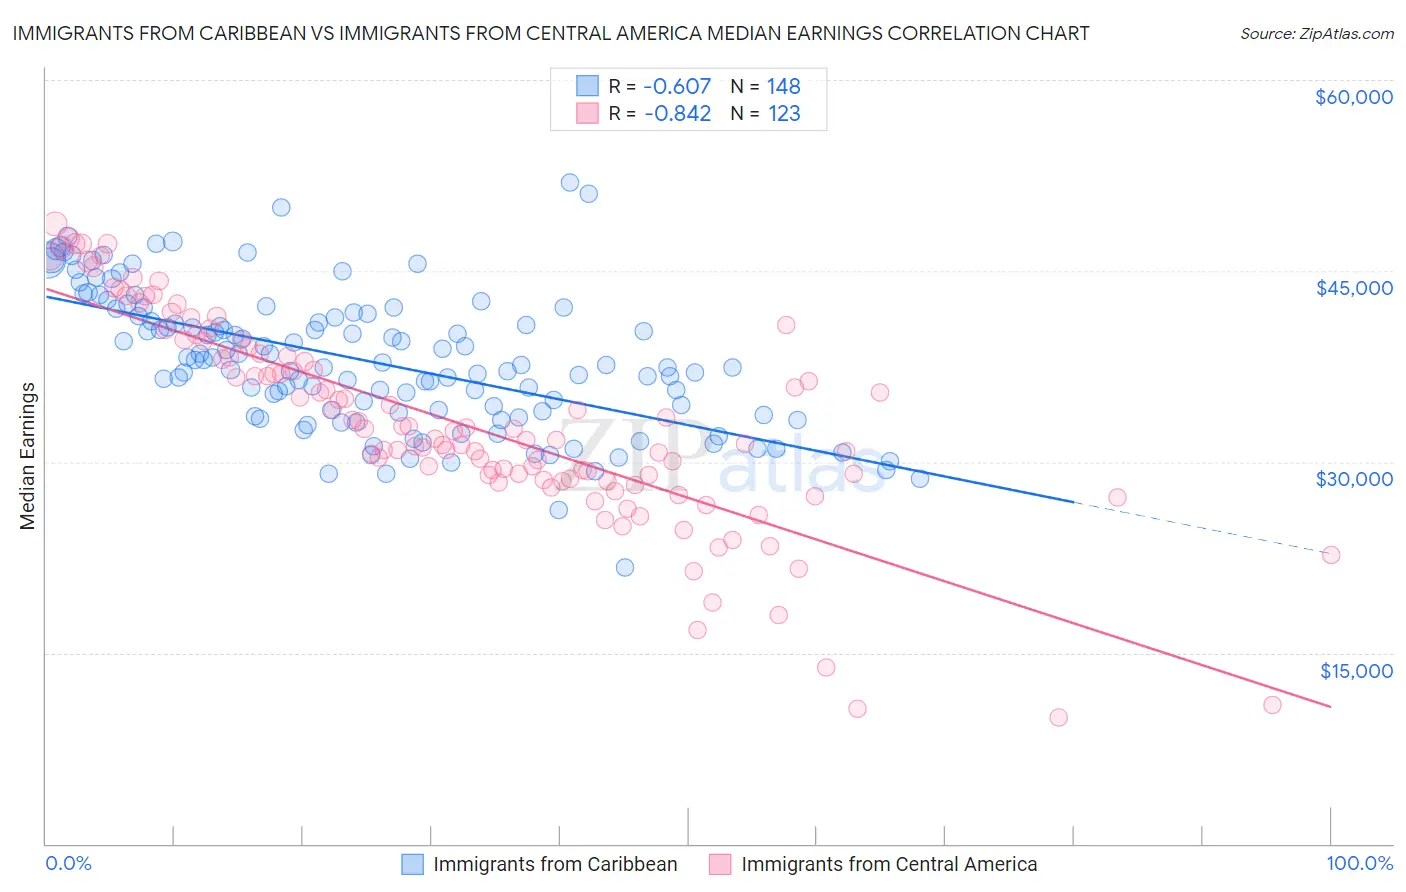
Immigrants from Caribbean vs Immigrants from Central America Median Earnings Correlation Chart
The statistical analysis conducted on geographies consisting of 450,013,484 people shows a significant negative correlation between the proportion of Immigrants from Caribbean and median earnings in the United States with a correlation coefficient (R) of -0.607 and weighted average of $41,119. Similarly, the statistical analysis conducted on geographies consisting of 536,322,180 people shows a very strong negative correlation between the proportion of Immigrants from Central America and median earnings in the United States with a correlation coefficient (R) of -0.842 and weighted average of $39,762, a difference of 3.4%.
Median Earnings Correlation Summary
| Measurement | Immigrants from Caribbean | Immigrants from Central America |
| Minimum | $21,741 | $9,917 |
| Maximum | $51,911 | $48,696 |
| Range | $30,170 | $38,779 |
| Mean | $37,958 | $33,043 |
| Median | $37,629 | $32,380 |
| Interquartile 25% (IQ1) | $33,921 | $28,620 |
| Interquartile 75% (IQ3) | $41,541 | $38,496 |
| Interquartile Range (IQR) | $7,620 | $9,875 |
| Standard Deviation (Sample) | $5,439 | $8,045 |
| Standard Deviation (Population) | $5,421 | $8,012 |
Similar Demographics by Median Earnings
Demographics Similar to Immigrants from Caribbean by Median Earnings
In terms of median earnings, the demographic groups most similar to Immigrants from Caribbean are Immigrants from Micronesia ($41,133, a difference of 0.030%), Ute ($41,051, a difference of 0.17%), Immigrants from Latin America ($41,049, a difference of 0.17%), Guatemalan ($41,205, a difference of 0.21%), and Cherokee ($41,252, a difference of 0.32%).
| Demographics | Rating | Rank | Median Earnings |
| U.S. Virgin Islanders | 0.1 /100 | #292 | Tragic $41,448 |
| Immigrants | Zaire | 0.1 /100 | #293 | Tragic $41,325 |
| Potawatomi | 0.1 /100 | #294 | Tragic $41,288 |
| Bangladeshis | 0.1 /100 | #295 | Tragic $41,263 |
| Cherokee | 0.1 /100 | #296 | Tragic $41,252 |
| Guatemalans | 0.1 /100 | #297 | Tragic $41,205 |
| Immigrants | Micronesia | 0.1 /100 | #298 | Tragic $41,133 |
| Immigrants | Caribbean | 0.1 /100 | #299 | Tragic $41,119 |
| Ute | 0.1 /100 | #300 | Tragic $41,051 |
| Immigrants | Latin America | 0.1 /100 | #301 | Tragic $41,049 |
| Shoshone | 0.0 /100 | #302 | Tragic $40,932 |
| Haitians | 0.0 /100 | #303 | Tragic $40,918 |
| Immigrants | Guatemala | 0.0 /100 | #304 | Tragic $40,851 |
| Chickasaw | 0.0 /100 | #305 | Tragic $40,672 |
| Yaqui | 0.0 /100 | #306 | Tragic $40,647 |
Demographics Similar to Immigrants from Central America by Median Earnings
In terms of median earnings, the demographic groups most similar to Immigrants from Central America are Bahamian ($39,735, a difference of 0.070%), Ottawa ($39,721, a difference of 0.10%), Mexican ($39,834, a difference of 0.18%), Immigrants from Bahamas ($39,861, a difference of 0.25%), and Creek ($39,648, a difference of 0.29%).
| Demographics | Rating | Rank | Median Earnings |
| Seminole | 0.0 /100 | #315 | Tragic $40,233 |
| Immigrants | Honduras | 0.0 /100 | #316 | Tragic $40,195 |
| Fijians | 0.0 /100 | #317 | Tragic $40,193 |
| Dutch West Indians | 0.0 /100 | #318 | Tragic $40,107 |
| Blacks/African Americans | 0.0 /100 | #319 | Tragic $40,085 |
| Immigrants | Bahamas | 0.0 /100 | #320 | Tragic $39,861 |
| Mexicans | 0.0 /100 | #321 | Tragic $39,834 |
| Immigrants | Central America | 0.0 /100 | #322 | Tragic $39,762 |
| Bahamians | 0.0 /100 | #323 | Tragic $39,735 |
| Ottawa | 0.0 /100 | #324 | Tragic $39,721 |
| Creek | 0.0 /100 | #325 | Tragic $39,648 |
| Immigrants | Yemen | 0.0 /100 | #326 | Tragic $39,540 |
| Yuman | 0.0 /100 | #327 | Tragic $39,523 |
| Sioux | 0.0 /100 | #328 | Tragic $39,448 |
| Kiowa | 0.0 /100 | #329 | Tragic $39,232 |