Immigrants from Chile vs Cambodian Median Earnings
COMPARE
Immigrants from Chile
Cambodian
Median Earnings
Median Earnings Comparison
Immigrants from Chile
Cambodians
$47,697
MEDIAN EARNINGS
85.5/ 100
METRIC RATING
146th/ 347
METRIC RANK
$53,386
MEDIAN EARNINGS
100.0/ 100
METRIC RATING
30th/ 347
METRIC RANK
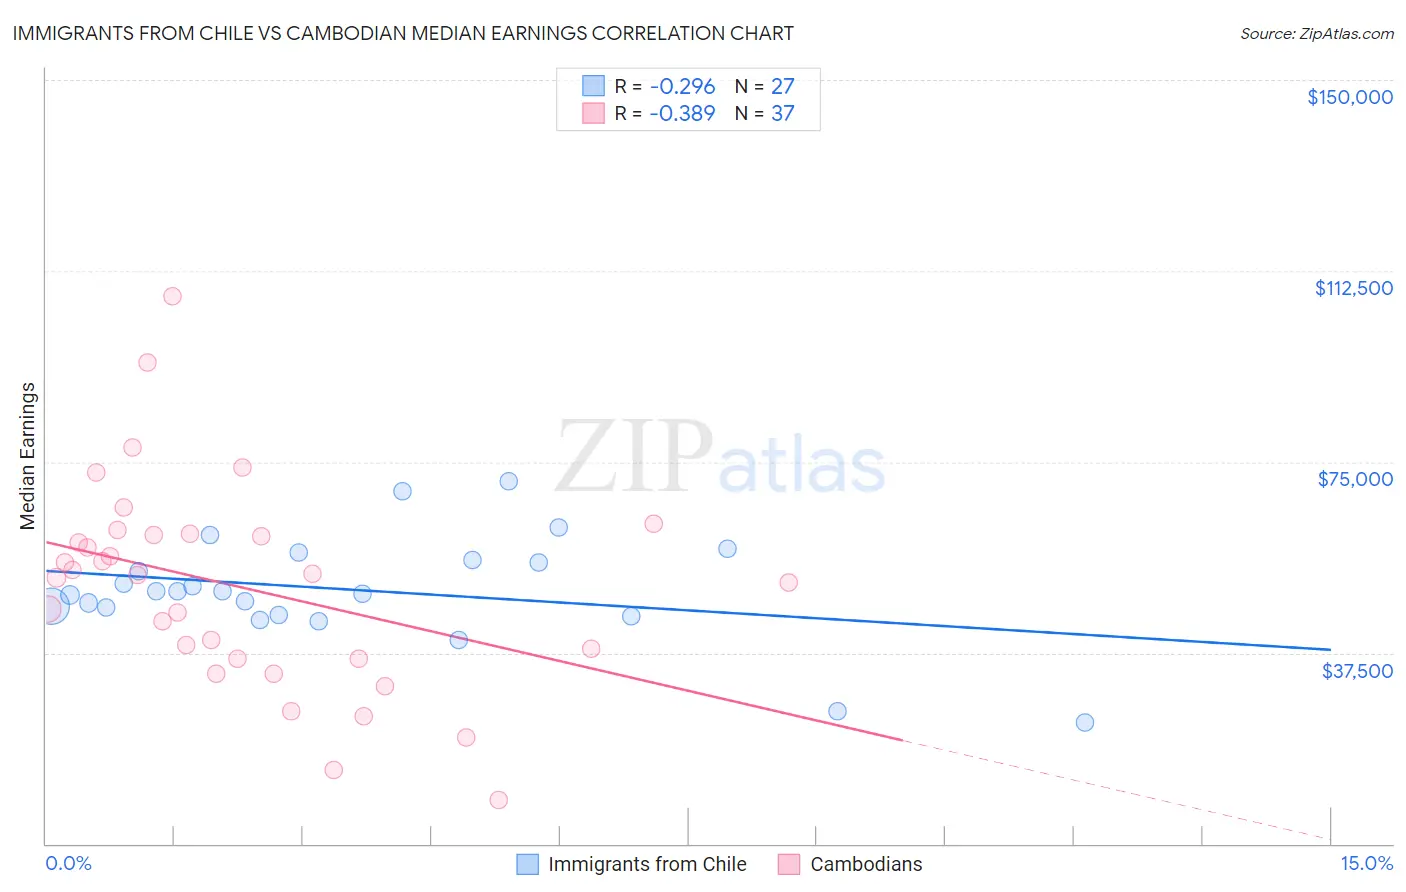
Immigrants from Chile vs Cambodian Median Earnings Correlation Chart
The statistical analysis conducted on geographies consisting of 218,645,469 people shows a weak negative correlation between the proportion of Immigrants from Chile and median earnings in the United States with a correlation coefficient (R) of -0.296 and weighted average of $47,697. Similarly, the statistical analysis conducted on geographies consisting of 102,521,064 people shows a mild negative correlation between the proportion of Cambodians and median earnings in the United States with a correlation coefficient (R) of -0.389 and weighted average of $53,386, a difference of 11.9%.
Median Earnings Correlation Summary
| Measurement | Immigrants from Chile | Cambodian |
| Minimum | $23,911 | $8,623 |
| Maximum | $71,250 | $107,569 |
| Range | $47,339 | $98,946 |
| Mean | $49,886 | $50,400 |
| Median | $49,642 | $52,839 |
| Interquartile 25% (IQ1) | $45,024 | $36,414 |
| Interquartile 75% (IQ3) | $55,791 | $60,699 |
| Interquartile Range (IQR) | $10,767 | $24,284 |
| Standard Deviation (Sample) | $10,356 | $20,473 |
| Standard Deviation (Population) | $10,162 | $20,194 |
Similar Demographics by Median Earnings
Demographics Similar to Immigrants from Chile by Median Earnings
In terms of median earnings, the demographic groups most similar to Immigrants from Chile are Immigrants from Saudi Arabia ($47,704, a difference of 0.010%), Immigrants from South Eastern Asia ($47,671, a difference of 0.060%), Immigrants from Eritrea ($47,657, a difference of 0.080%), Luxembourger ($47,640, a difference of 0.12%), and Peruvian ($47,628, a difference of 0.15%).
| Demographics | Rating | Rank | Median Earnings |
| Canadians | 88.8 /100 | #139 | Excellent $47,911 |
| Taiwanese | 88.7 /100 | #140 | Excellent $47,902 |
| Immigrants | Sierra Leone | 88.3 /100 | #141 | Excellent $47,875 |
| Ugandans | 88.0 /100 | #142 | Excellent $47,854 |
| Swedes | 88.0 /100 | #143 | Excellent $47,851 |
| Hungarians | 87.1 /100 | #144 | Excellent $47,795 |
| Immigrants | Saudi Arabia | 85.6 /100 | #145 | Excellent $47,704 |
| Immigrants | Chile | 85.5 /100 | #146 | Excellent $47,697 |
| Immigrants | South Eastern Asia | 85.0 /100 | #147 | Excellent $47,671 |
| Immigrants | Eritrea | 84.8 /100 | #148 | Excellent $47,657 |
| Luxembourgers | 84.5 /100 | #149 | Excellent $47,640 |
| Peruvians | 84.2 /100 | #150 | Excellent $47,628 |
| Immigrants | Oceania | 84.1 /100 | #151 | Excellent $47,617 |
| Immigrants | Germany | 83.1 /100 | #152 | Excellent $47,566 |
| Slavs | 81.1 /100 | #153 | Excellent $47,470 |
Demographics Similar to Cambodians by Median Earnings
In terms of median earnings, the demographic groups most similar to Cambodians are Russian ($53,334, a difference of 0.10%), Immigrants from Russia ($53,457, a difference of 0.13%), Immigrants from Asia ($53,310, a difference of 0.14%), Immigrants from Greece ($53,282, a difference of 0.19%), and Immigrants from France ($53,490, a difference of 0.20%).
| Demographics | Rating | Rank | Median Earnings |
| Immigrants | Sweden | 100.0 /100 | #23 | Exceptional $54,478 |
| Soviet Union | 100.0 /100 | #24 | Exceptional $54,290 |
| Turks | 100.0 /100 | #25 | Exceptional $53,919 |
| Immigrants | Northern Europe | 100.0 /100 | #26 | Exceptional $53,872 |
| Asians | 100.0 /100 | #27 | Exceptional $53,690 |
| Immigrants | France | 100.0 /100 | #28 | Exceptional $53,490 |
| Immigrants | Russia | 100.0 /100 | #29 | Exceptional $53,457 |
| Cambodians | 100.0 /100 | #30 | Exceptional $53,386 |
| Russians | 100.0 /100 | #31 | Exceptional $53,334 |
| Immigrants | Asia | 100.0 /100 | #32 | Exceptional $53,310 |
| Immigrants | Greece | 100.0 /100 | #33 | Exceptional $53,282 |
| Immigrants | Sri Lanka | 100.0 /100 | #34 | Exceptional $53,268 |
| Immigrants | Switzerland | 100.0 /100 | #35 | Exceptional $53,211 |
| Immigrants | Denmark | 100.0 /100 | #36 | Exceptional $53,186 |
| Immigrants | Belarus | 100.0 /100 | #37 | Exceptional $53,043 |