Immigrants from West Indies vs Cambodian Median Earnings
COMPARE
Immigrants from West Indies
Cambodian
Median Earnings
Median Earnings Comparison
Immigrants from West Indies
Cambodians
$43,989
MEDIAN EARNINGS
3.1/ 100
METRIC RATING
246th/ 347
METRIC RANK
$53,386
MEDIAN EARNINGS
100.0/ 100
METRIC RATING
30th/ 347
METRIC RANK
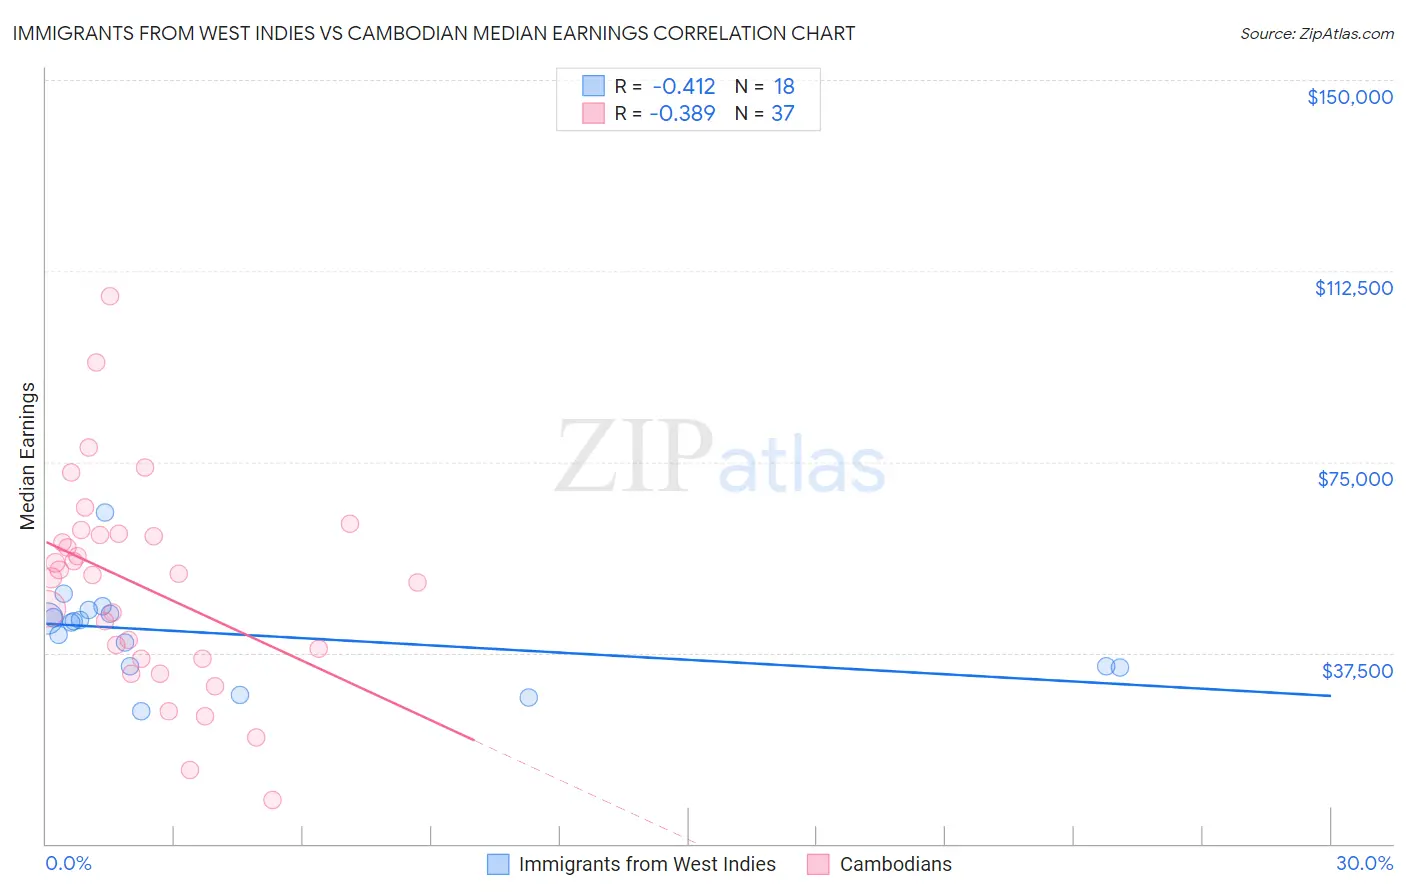
Immigrants from West Indies vs Cambodian Median Earnings Correlation Chart
The statistical analysis conducted on geographies consisting of 72,420,477 people shows a moderate negative correlation between the proportion of Immigrants from West Indies and median earnings in the United States with a correlation coefficient (R) of -0.412 and weighted average of $43,989. Similarly, the statistical analysis conducted on geographies consisting of 102,521,064 people shows a mild negative correlation between the proportion of Cambodians and median earnings in the United States with a correlation coefficient (R) of -0.389 and weighted average of $53,386, a difference of 21.4%.
Median Earnings Correlation Summary
| Measurement | Immigrants from West Indies | Cambodian |
| Minimum | $26,000 | $8,623 |
| Maximum | $64,982 | $107,569 |
| Range | $38,982 | $98,946 |
| Mean | $41,111 | $50,400 |
| Median | $43,487 | $52,839 |
| Interquartile 25% (IQ1) | $34,810 | $36,414 |
| Interquartile 75% (IQ3) | $45,119 | $60,699 |
| Interquartile Range (IQR) | $10,309 | $24,284 |
| Standard Deviation (Sample) | $9,035 | $20,473 |
| Standard Deviation (Population) | $8,780 | $20,194 |
Similar Demographics by Median Earnings
Demographics Similar to Immigrants from West Indies by Median Earnings
In terms of median earnings, the demographic groups most similar to Immigrants from West Indies are Immigrants from Burma/Myanmar ($43,998, a difference of 0.020%), Immigrants from Cabo Verde ($43,963, a difference of 0.060%), Subsaharan African ($44,118, a difference of 0.29%), Nonimmigrants ($44,117, a difference of 0.29%), and Nepalese ($43,860, a difference of 0.29%).
| Demographics | Rating | Rank | Median Earnings |
| Senegalese | 5.3 /100 | #239 | Tragic $44,373 |
| Aleuts | 4.4 /100 | #240 | Tragic $44,241 |
| Samoans | 4.2 /100 | #241 | Tragic $44,206 |
| Immigrants | Venezuela | 4.0 /100 | #242 | Tragic $44,163 |
| Sub-Saharan Africans | 3.7 /100 | #243 | Tragic $44,118 |
| Immigrants | Nonimmigrants | 3.7 /100 | #244 | Tragic $44,117 |
| Immigrants | Burma/Myanmar | 3.2 /100 | #245 | Tragic $43,998 |
| Immigrants | West Indies | 3.1 /100 | #246 | Tragic $43,989 |
| Immigrants | Cabo Verde | 3.0 /100 | #247 | Tragic $43,963 |
| Nepalese | 2.6 /100 | #248 | Tragic $43,860 |
| Malaysians | 2.6 /100 | #249 | Tragic $43,844 |
| Alaska Natives | 2.3 /100 | #250 | Tragic $43,750 |
| Tsimshian | 2.1 /100 | #251 | Tragic $43,695 |
| Hawaiians | 2.0 /100 | #252 | Tragic $43,673 |
| Somalis | 1.8 /100 | #253 | Tragic $43,567 |
Demographics Similar to Cambodians by Median Earnings
In terms of median earnings, the demographic groups most similar to Cambodians are Russian ($53,334, a difference of 0.10%), Immigrants from Russia ($53,457, a difference of 0.13%), Immigrants from Asia ($53,310, a difference of 0.14%), Immigrants from Greece ($53,282, a difference of 0.19%), and Immigrants from France ($53,490, a difference of 0.20%).
| Demographics | Rating | Rank | Median Earnings |
| Immigrants | Sweden | 100.0 /100 | #23 | Exceptional $54,478 |
| Soviet Union | 100.0 /100 | #24 | Exceptional $54,290 |
| Turks | 100.0 /100 | #25 | Exceptional $53,919 |
| Immigrants | Northern Europe | 100.0 /100 | #26 | Exceptional $53,872 |
| Asians | 100.0 /100 | #27 | Exceptional $53,690 |
| Immigrants | France | 100.0 /100 | #28 | Exceptional $53,490 |
| Immigrants | Russia | 100.0 /100 | #29 | Exceptional $53,457 |
| Cambodians | 100.0 /100 | #30 | Exceptional $53,386 |
| Russians | 100.0 /100 | #31 | Exceptional $53,334 |
| Immigrants | Asia | 100.0 /100 | #32 | Exceptional $53,310 |
| Immigrants | Greece | 100.0 /100 | #33 | Exceptional $53,282 |
| Immigrants | Sri Lanka | 100.0 /100 | #34 | Exceptional $53,268 |
| Immigrants | Switzerland | 100.0 /100 | #35 | Exceptional $53,211 |
| Immigrants | Denmark | 100.0 /100 | #36 | Exceptional $53,186 |
| Immigrants | Belarus | 100.0 /100 | #37 | Exceptional $53,043 |