Immigrants from Cabo Verde vs French Canadian Unemployment
COMPARE
Immigrants from Cabo Verde
French Canadian
Unemployment
Unemployment Comparison
Immigrants from Cabo Verde
French Canadians
6.8%
UNEMPLOYMENT
0.0/ 100
METRIC RATING
318th/ 347
METRIC RANK
4.9%
UNEMPLOYMENT
99.3/ 100
METRIC RATING
50th/ 347
METRIC RANK
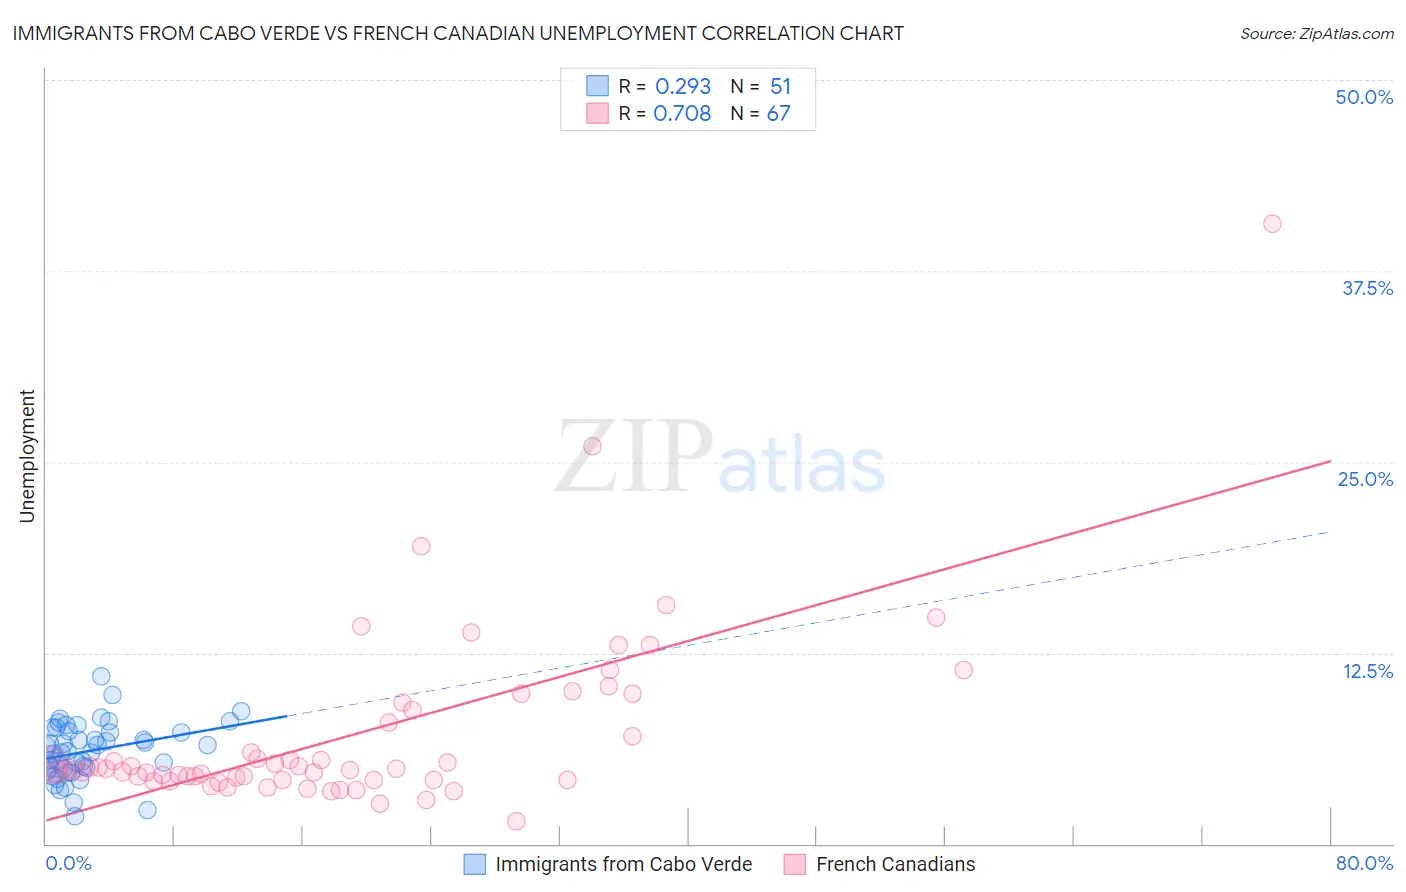
Immigrants from Cabo Verde vs French Canadian Unemployment Correlation Chart
The statistical analysis conducted on geographies consisting of 38,137,601 people shows a weak positive correlation between the proportion of Immigrants from Cabo Verde and unemployment in the United States with a correlation coefficient (R) of 0.293 and weighted average of 6.8%. Similarly, the statistical analysis conducted on geographies consisting of 500,867,403 people shows a strong positive correlation between the proportion of French Canadians and unemployment in the United States with a correlation coefficient (R) of 0.708 and weighted average of 4.9%, a difference of 40.4%.
Unemployment Correlation Summary
| Measurement | Immigrants from Cabo Verde | French Canadian |
| Minimum | 1.8% | 1.5% |
| Maximum | 11.0% | 40.6% |
| Range | 9.2% | 39.1% |
| Mean | 6.1% | 7.1% |
| Median | 6.1% | 4.9% |
| Interquartile 25% (IQ1) | 4.9% | 4.2% |
| Interquartile 75% (IQ3) | 7.4% | 8.7% |
| Interquartile Range (IQR) | 2.4% | 4.5% |
| Standard Deviation (Sample) | 1.8% | 6.0% |
| Standard Deviation (Population) | 1.8% | 6.0% |
Similar Demographics by Unemployment
Demographics Similar to Immigrants from Cabo Verde by Unemployment
In terms of unemployment, the demographic groups most similar to Immigrants from Cabo Verde are British West Indian (6.8%, a difference of 0.21%), Shoshone (6.8%, a difference of 0.60%), Immigrants from St. Vincent and the Grenadines (6.9%, a difference of 1.0%), Immigrants from Guyana (6.9%, a difference of 1.0%), and Guyanese (6.9%, a difference of 1.1%).
| Demographics | Rating | Rank | Unemployment |
| Cape Verdeans | 0.0 /100 | #311 | Tragic 6.5% |
| Colville | 0.0 /100 | #312 | Tragic 6.6% |
| Immigrants | Barbados | 0.0 /100 | #313 | Tragic 6.6% |
| Blacks/African Americans | 0.0 /100 | #314 | Tragic 6.6% |
| Houma | 0.0 /100 | #315 | Tragic 6.7% |
| Immigrants | Dominica | 0.0 /100 | #316 | Tragic 6.7% |
| Shoshone | 0.0 /100 | #317 | Tragic 6.8% |
| Immigrants | Cabo Verde | 0.0 /100 | #318 | Tragic 6.8% |
| British West Indians | 0.0 /100 | #319 | Tragic 6.8% |
| Immigrants | St. Vincent and the Grenadines | 0.0 /100 | #320 | Tragic 6.9% |
| Immigrants | Guyana | 0.0 /100 | #321 | Tragic 6.9% |
| Guyanese | 0.0 /100 | #322 | Tragic 6.9% |
| Immigrants | Grenada | 0.0 /100 | #323 | Tragic 6.9% |
| Immigrants | Armenia | 0.0 /100 | #324 | Tragic 7.0% |
| Natives/Alaskans | 0.0 /100 | #325 | Tragic 7.0% |
Demographics Similar to French Canadians by Unemployment
In terms of unemployment, the demographic groups most similar to French Canadians are Immigrants from South Central Asia (4.9%, a difference of 0.020%), Immigrants from Scotland (4.9%, a difference of 0.030%), Immigrants from Belgium (4.9%, a difference of 0.16%), White/Caucasian (4.9%, a difference of 0.17%), and Immigrants from Zimbabwe (4.9%, a difference of 0.20%).
| Demographics | Rating | Rank | Unemployment |
| Yugoslavians | 99.5 /100 | #43 | Exceptional 4.8% |
| Austrians | 99.5 /100 | #44 | Exceptional 4.8% |
| French | 99.5 /100 | #45 | Exceptional 4.8% |
| Immigrants | Nepal | 99.4 /100 | #46 | Exceptional 4.8% |
| Immigrants | Taiwan | 99.4 /100 | #47 | Exceptional 4.8% |
| Immigrants | Scotland | 99.3 /100 | #48 | Exceptional 4.9% |
| Immigrants | South Central Asia | 99.3 /100 | #49 | Exceptional 4.9% |
| French Canadians | 99.3 /100 | #50 | Exceptional 4.9% |
| Immigrants | Belgium | 99.2 /100 | #51 | Exceptional 4.9% |
| Whites/Caucasians | 99.2 /100 | #52 | Exceptional 4.9% |
| Immigrants | Zimbabwe | 99.2 /100 | #53 | Exceptional 4.9% |
| Eastern Europeans | 99.2 /100 | #54 | Exceptional 4.9% |
| Australians | 99.2 /100 | #55 | Exceptional 4.9% |
| Celtics | 99.1 /100 | #56 | Exceptional 4.9% |
| Immigrants | Singapore | 99.1 /100 | #57 | Exceptional 4.9% |