Immigrants from Burma/Myanmar vs Sri Lankan Householder Income Over 65 years
COMPARE
Immigrants from Burma/Myanmar
Sri Lankan
Householder Income Over 65 years
Householder Income Over 65 years Comparison
Immigrants from Burma/Myanmar
Sri Lankans
$57,114
HOUSEHOLDER INCOME OVER 65 YEARS
1.7/ 100
METRIC RATING
234th/ 347
METRIC RANK
$64,201
HOUSEHOLDER INCOME OVER 65 YEARS
96.7/ 100
METRIC RATING
97th/ 347
METRIC RANK
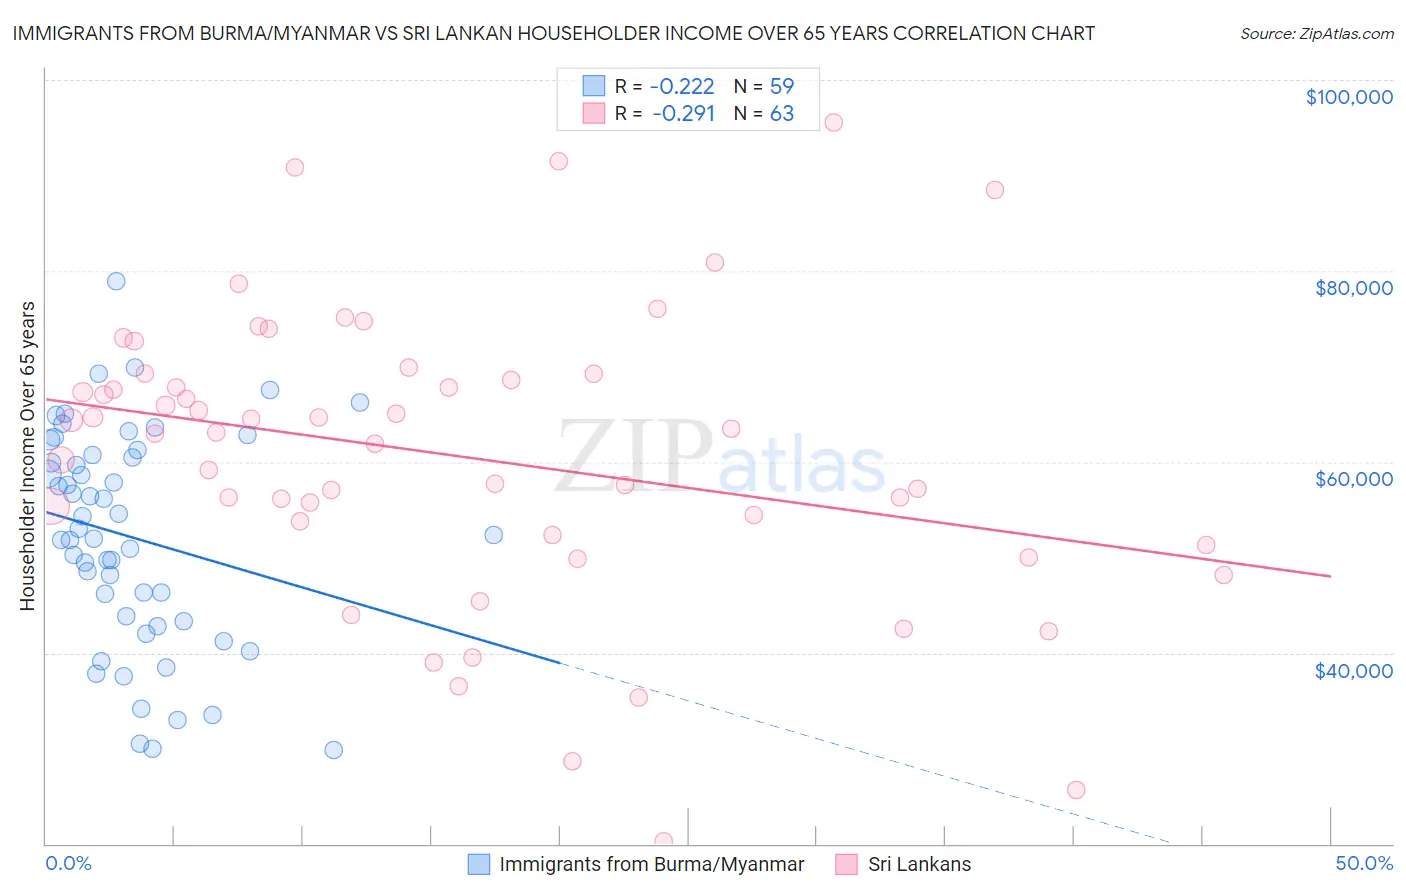
Immigrants from Burma/Myanmar vs Sri Lankan Householder Income Over 65 years Correlation Chart
The statistical analysis conducted on geographies consisting of 172,033,501 people shows a weak negative correlation between the proportion of Immigrants from Burma/Myanmar and household income with householder over the age of 65 in the United States with a correlation coefficient (R) of -0.222 and weighted average of $57,114. Similarly, the statistical analysis conducted on geographies consisting of 438,467,374 people shows a weak negative correlation between the proportion of Sri Lankans and household income with householder over the age of 65 in the United States with a correlation coefficient (R) of -0.291 and weighted average of $64,201, a difference of 12.4%.
Householder Income Over 65 years Correlation Summary
| Measurement | Immigrants from Burma/Myanmar | Sri Lankan |
| Minimum | $29,861 | $20,238 |
| Maximum | $78,969 | $95,504 |
| Range | $49,108 | $75,266 |
| Mean | $52,112 | $60,635 |
| Median | $52,321 | $63,086 |
| Interquartile 25% (IQ1) | $43,364 | $52,337 |
| Interquartile 75% (IQ3) | $60,699 | $69,167 |
| Interquartile Range (IQR) | $17,335 | $16,830 |
| Standard Deviation (Sample) | $11,315 | $15,340 |
| Standard Deviation (Population) | $11,219 | $15,218 |
Similar Demographics by Householder Income Over 65 years
Demographics Similar to Immigrants from Burma/Myanmar by Householder Income Over 65 years
In terms of householder income over 65 years, the demographic groups most similar to Immigrants from Burma/Myanmar are Immigrants from Western Africa ($57,119, a difference of 0.010%), Spanish American ($57,021, a difference of 0.16%), Immigrants from Uruguay ($56,975, a difference of 0.24%), Immigrants from Panama ($56,944, a difference of 0.30%), and Immigrants from Venezuela ($57,371, a difference of 0.45%).
| Demographics | Rating | Rank | Householder Income Over 65 years |
| Japanese | 3.9 /100 | #227 | Tragic $57,919 |
| Immigrants | Albania | 3.6 /100 | #228 | Tragic $57,828 |
| Immigrants | Colombia | 3.0 /100 | #229 | Tragic $57,658 |
| Immigrants | Cambodia | 2.8 /100 | #230 | Tragic $57,580 |
| Immigrants | Nonimmigrants | 2.4 /100 | #231 | Tragic $57,426 |
| Immigrants | Venezuela | 2.3 /100 | #232 | Tragic $57,371 |
| Immigrants | Western Africa | 1.7 /100 | #233 | Tragic $57,119 |
| Immigrants | Burma/Myanmar | 1.7 /100 | #234 | Tragic $57,114 |
| Spanish Americans | 1.6 /100 | #235 | Tragic $57,021 |
| Immigrants | Uruguay | 1.5 /100 | #236 | Tragic $56,975 |
| Immigrants | Panama | 1.5 /100 | #237 | Tragic $56,944 |
| Fijians | 1.2 /100 | #238 | Tragic $56,768 |
| Immigrants | Laos | 1.2 /100 | #239 | Tragic $56,722 |
| Sub-Saharan Africans | 1.0 /100 | #240 | Tragic $56,615 |
| Immigrants | Guyana | 0.9 /100 | #241 | Tragic $56,495 |
Demographics Similar to Sri Lankans by Householder Income Over 65 years
In terms of householder income over 65 years, the demographic groups most similar to Sri Lankans are Romanian ($64,142, a difference of 0.090%), Immigrants from Hungary ($64,277, a difference of 0.12%), Assyrian/Chaldean/Syriac ($64,108, a difference of 0.14%), Immigrants from Egypt ($64,299, a difference of 0.15%), and Immigrants from Latvia ($64,298, a difference of 0.15%).
| Demographics | Rating | Rank | Householder Income Over 65 years |
| Immigrants | Kuwait | 97.4 /100 | #90 | Exceptional $64,433 |
| Immigrants | Oceania | 97.4 /100 | #91 | Exceptional $64,416 |
| Immigrants | Bulgaria | 97.3 /100 | #92 | Exceptional $64,379 |
| Jordanians | 97.1 /100 | #93 | Exceptional $64,313 |
| Immigrants | Egypt | 97.0 /100 | #94 | Exceptional $64,299 |
| Immigrants | Latvia | 97.0 /100 | #95 | Exceptional $64,298 |
| Immigrants | Hungary | 97.0 /100 | #96 | Exceptional $64,277 |
| Sri Lankans | 96.7 /100 | #97 | Exceptional $64,201 |
| Romanians | 96.5 /100 | #98 | Exceptional $64,142 |
| Assyrians/Chaldeans/Syriacs | 96.4 /100 | #99 | Exceptional $64,108 |
| Immigrants | South Eastern Asia | 96.3 /100 | #100 | Exceptional $64,089 |
| Immigrants | Italy | 96.2 /100 | #101 | Exceptional $64,065 |
| Chileans | 95.8 /100 | #102 | Exceptional $63,957 |
| British | 95.7 /100 | #103 | Exceptional $63,940 |
| Immigrants | Cameroon | 95.6 /100 | #104 | Exceptional $63,907 |