Immigrants from Burma/Myanmar vs Hmong Householder Income Over 65 years
COMPARE
Immigrants from Burma/Myanmar
Hmong
Householder Income Over 65 years
Householder Income Over 65 years Comparison
Immigrants from Burma/Myanmar
Hmong
$57,114
HOUSEHOLDER INCOME OVER 65 YEARS
1.7/ 100
METRIC RATING
234th/ 347
METRIC RANK
$56,339
HOUSEHOLDER INCOME OVER 65 YEARS
0.8/ 100
METRIC RATING
244th/ 347
METRIC RANK
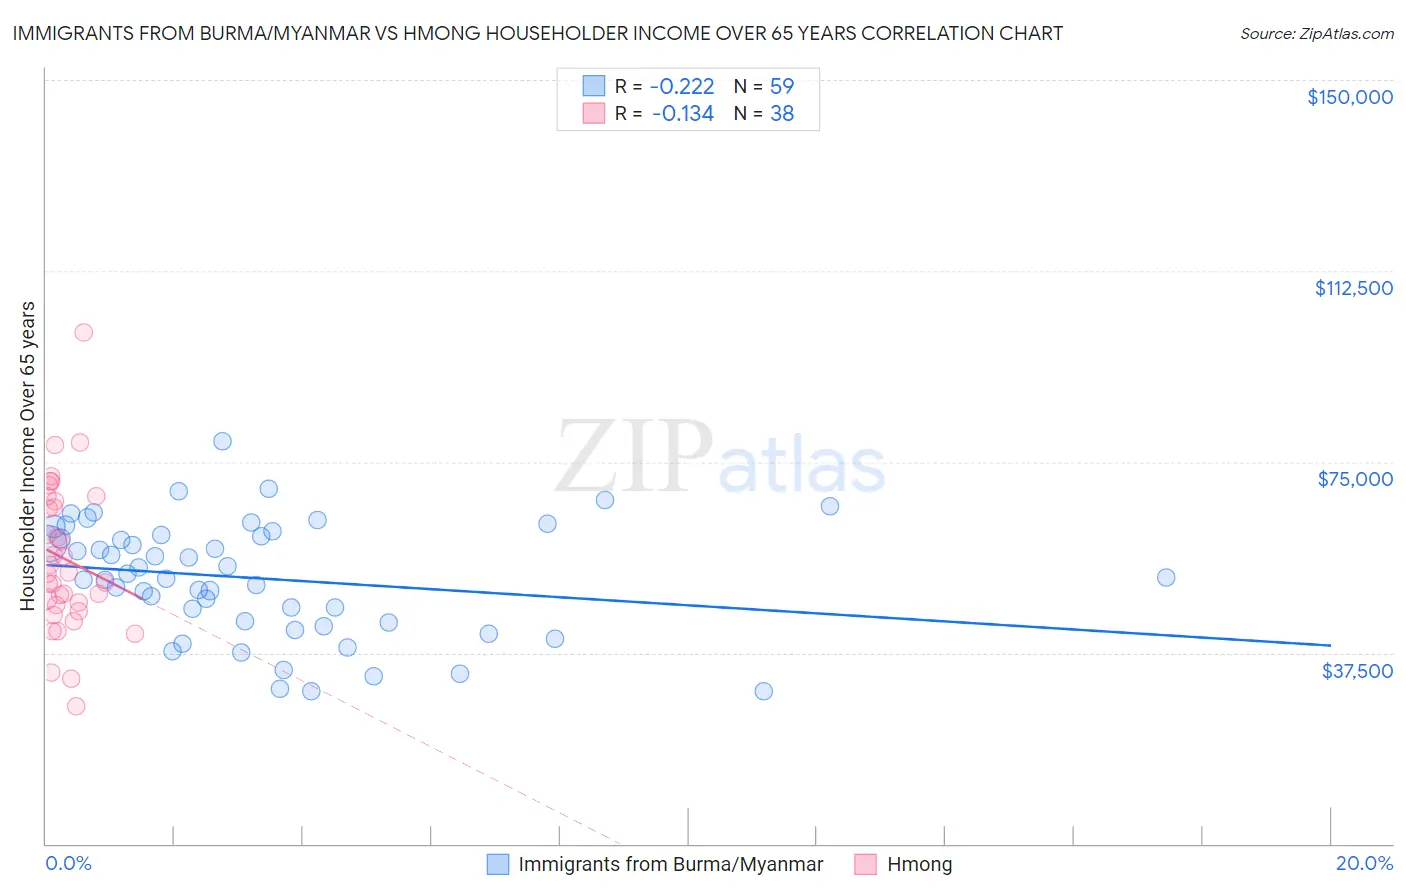
Immigrants from Burma/Myanmar vs Hmong Householder Income Over 65 years Correlation Chart
The statistical analysis conducted on geographies consisting of 172,033,501 people shows a weak negative correlation between the proportion of Immigrants from Burma/Myanmar and household income with householder over the age of 65 in the United States with a correlation coefficient (R) of -0.222 and weighted average of $57,114. Similarly, the statistical analysis conducted on geographies consisting of 24,664,732 people shows a poor negative correlation between the proportion of Hmong and household income with householder over the age of 65 in the United States with a correlation coefficient (R) of -0.134 and weighted average of $56,339, a difference of 1.4%.
Householder Income Over 65 years Correlation Summary
| Measurement | Immigrants from Burma/Myanmar | Hmong |
| Minimum | $29,861 | $27,125 |
| Maximum | $78,969 | $100,402 |
| Range | $49,108 | $73,277 |
| Mean | $52,112 | $56,016 |
| Median | $52,321 | $53,213 |
| Interquartile 25% (IQ1) | $43,364 | $46,982 |
| Interquartile 75% (IQ3) | $60,699 | $67,354 |
| Interquartile Range (IQR) | $17,335 | $20,372 |
| Standard Deviation (Sample) | $11,315 | $14,666 |
| Standard Deviation (Population) | $11,219 | $14,471 |
Demographics Similar to Immigrants from Burma/Myanmar and Hmong by Householder Income Over 65 years
In terms of householder income over 65 years, the demographic groups most similar to Immigrants from Burma/Myanmar are Immigrants from Western Africa ($57,119, a difference of 0.010%), Spanish American ($57,021, a difference of 0.16%), Immigrants from Uruguay ($56,975, a difference of 0.24%), Immigrants from Panama ($56,944, a difference of 0.30%), and Immigrants from Venezuela ($57,371, a difference of 0.45%). Similarly, the demographic groups most similar to Hmong are Guyanese ($56,351, a difference of 0.020%), Immigrants from Uzbekistan ($56,331, a difference of 0.020%), Central American ($56,321, a difference of 0.030%), Yaqui ($56,417, a difference of 0.14%), and Yakama ($56,234, a difference of 0.19%).
| Demographics | Rating | Rank | Householder Income Over 65 years |
| Immigrants | Colombia | 3.0 /100 | #229 | Tragic $57,658 |
| Immigrants | Cambodia | 2.8 /100 | #230 | Tragic $57,580 |
| Immigrants | Nonimmigrants | 2.4 /100 | #231 | Tragic $57,426 |
| Immigrants | Venezuela | 2.3 /100 | #232 | Tragic $57,371 |
| Immigrants | Western Africa | 1.7 /100 | #233 | Tragic $57,119 |
| Immigrants | Burma/Myanmar | 1.7 /100 | #234 | Tragic $57,114 |
| Spanish Americans | 1.6 /100 | #235 | Tragic $57,021 |
| Immigrants | Uruguay | 1.5 /100 | #236 | Tragic $56,975 |
| Immigrants | Panama | 1.5 /100 | #237 | Tragic $56,944 |
| Fijians | 1.2 /100 | #238 | Tragic $56,768 |
| Immigrants | Laos | 1.2 /100 | #239 | Tragic $56,722 |
| Sub-Saharan Africans | 1.0 /100 | #240 | Tragic $56,615 |
| Immigrants | Guyana | 0.9 /100 | #241 | Tragic $56,495 |
| Yaqui | 0.8 /100 | #242 | Tragic $56,417 |
| Guyanese | 0.8 /100 | #243 | Tragic $56,351 |
| Hmong | 0.8 /100 | #244 | Tragic $56,339 |
| Immigrants | Uzbekistan | 0.8 /100 | #245 | Tragic $56,331 |
| Central Americans | 0.8 /100 | #246 | Tragic $56,321 |
| Yakama | 0.7 /100 | #247 | Tragic $56,234 |
| Vietnamese | 0.6 /100 | #248 | Tragic $56,143 |
| Mexican American Indians | 0.6 /100 | #249 | Tragic $56,089 |