English vs White/Caucasian Householder Income Over 65 years
COMPARE
English
White/Caucasian
Householder Income Over 65 years
Householder Income Over 65 years Comparison
English
Whites/Caucasians
$61,487
HOUSEHOLDER INCOME OVER 65 YEARS
63.3/ 100
METRIC RATING
158th/ 347
METRIC RANK
$58,847
HOUSEHOLDER INCOME OVER 65 YEARS
9.8/ 100
METRIC RATING
213th/ 347
METRIC RANK
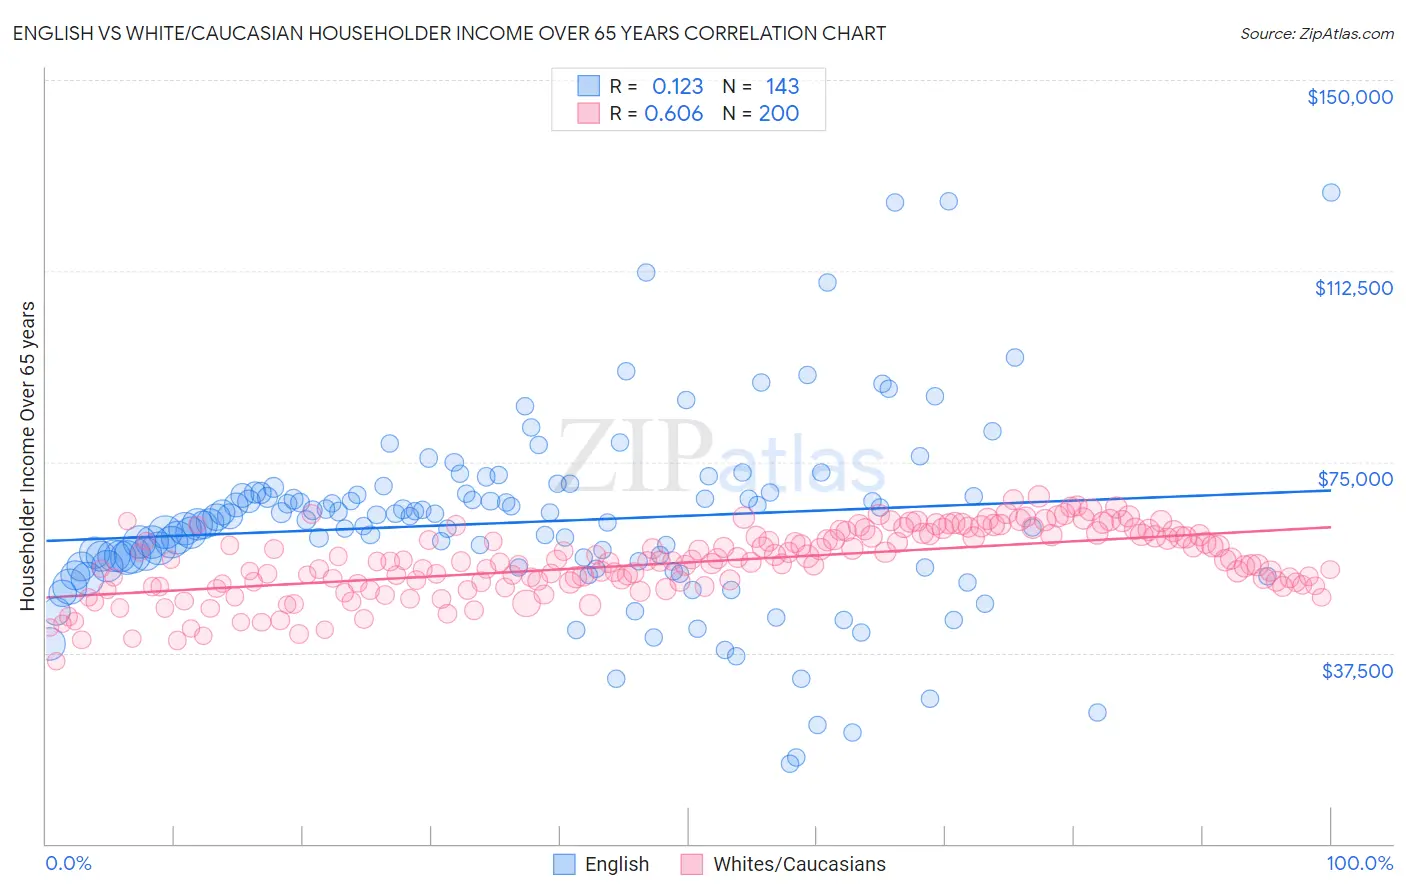
English vs White/Caucasian Householder Income Over 65 years Correlation Chart
The statistical analysis conducted on geographies consisting of 573,164,931 people shows a poor positive correlation between the proportion of English and household income with householder over the age of 65 in the United States with a correlation coefficient (R) of 0.123 and weighted average of $61,487. Similarly, the statistical analysis conducted on geographies consisting of 577,509,844 people shows a significant positive correlation between the proportion of Whites/Caucasians and household income with householder over the age of 65 in the United States with a correlation coefficient (R) of 0.606 and weighted average of $58,847, a difference of 4.5%.
Householder Income Over 65 years Correlation Summary
| Measurement | English | White/Caucasian |
| Minimum | $15,670 | $35,837 |
| Maximum | $127,891 | $68,217 |
| Range | $112,221 | $32,380 |
| Mean | $63,109 | $55,258 |
| Median | $63,519 | $55,418 |
| Interquartile 25% (IQ1) | $54,458 | $51,091 |
| Interquartile 75% (IQ3) | $68,838 | $60,670 |
| Interquartile Range (IQR) | $14,380 | $9,580 |
| Standard Deviation (Sample) | $18,180 | $6,600 |
| Standard Deviation (Population) | $18,116 | $6,583 |
Similar Demographics by Householder Income Over 65 years
Demographics Similar to English by Householder Income Over 65 years
In terms of householder income over 65 years, the demographic groups most similar to English are Brazilian ($61,465, a difference of 0.040%), Portuguese ($61,440, a difference of 0.080%), Macedonian ($61,564, a difference of 0.13%), Scandinavian ($61,586, a difference of 0.16%), and Polish ($61,598, a difference of 0.18%).
| Demographics | Rating | Rank | Householder Income Over 65 years |
| Hungarians | 67.7 /100 | #151 | Good $61,673 |
| Armenians | 67.3 /100 | #152 | Good $61,656 |
| Costa Ricans | 66.9 /100 | #153 | Good $61,638 |
| Swiss | 66.5 /100 | #154 | Good $61,621 |
| Poles | 65.9 /100 | #155 | Good $61,598 |
| Scandinavians | 65.6 /100 | #156 | Good $61,586 |
| Macedonians | 65.1 /100 | #157 | Good $61,564 |
| English | 63.3 /100 | #158 | Good $61,487 |
| Brazilians | 62.7 /100 | #159 | Good $61,465 |
| Portuguese | 62.1 /100 | #160 | Good $61,440 |
| Icelanders | 57.9 /100 | #161 | Average $61,270 |
| Czechs | 57.2 /100 | #162 | Average $61,244 |
| Ugandans | 55.5 /100 | #163 | Average $61,177 |
| Immigrants | North Macedonia | 55.4 /100 | #164 | Average $61,175 |
| Immigrants | Ukraine | 55.1 /100 | #165 | Average $61,163 |
Demographics Similar to Whites/Caucasians by Householder Income Over 65 years
In terms of householder income over 65 years, the demographic groups most similar to Whites/Caucasians are Colombian ($58,851, a difference of 0.010%), Nepalese ($58,761, a difference of 0.15%), Immigrants from Nigeria ($58,942, a difference of 0.16%), Nigerian ($58,992, a difference of 0.25%), and Slovak ($59,039, a difference of 0.33%).
| Demographics | Rating | Rank | Householder Income Over 65 years |
| Immigrants | South America | 13.0 /100 | #206 | Poor $59,151 |
| Salvadorans | 12.9 /100 | #207 | Poor $59,141 |
| Uruguayans | 12.3 /100 | #208 | Poor $59,090 |
| Slovaks | 11.7 /100 | #209 | Poor $59,039 |
| Nigerians | 11.2 /100 | #210 | Poor $58,992 |
| Immigrants | Nigeria | 10.7 /100 | #211 | Poor $58,942 |
| Colombians | 9.8 /100 | #212 | Tragic $58,851 |
| Whites/Caucasians | 9.8 /100 | #213 | Tragic $58,847 |
| Nepalese | 9.0 /100 | #214 | Tragic $58,761 |
| Immigrants | Ghana | 7.9 /100 | #215 | Tragic $58,624 |
| Immigrants | Middle Africa | 6.2 /100 | #216 | Tragic $58,375 |
| Sudanese | 5.7 /100 | #217 | Tragic $58,281 |
| Panamanians | 5.6 /100 | #218 | Tragic $58,266 |
| Malaysians | 5.5 /100 | #219 | Tragic $58,244 |
| Yugoslavians | 5.5 /100 | #220 | Tragic $58,243 |