Immigrants from Burma/Myanmar vs Argentinean Householder Income Over 65 years
COMPARE
Immigrants from Burma/Myanmar
Argentinean
Householder Income Over 65 years
Householder Income Over 65 years Comparison
Immigrants from Burma/Myanmar
Argentineans
$57,114
HOUSEHOLDER INCOME OVER 65 YEARS
1.7/ 100
METRIC RATING
234th/ 347
METRIC RANK
$65,246
HOUSEHOLDER INCOME OVER 65 YEARS
98.9/ 100
METRIC RATING
72nd/ 347
METRIC RANK
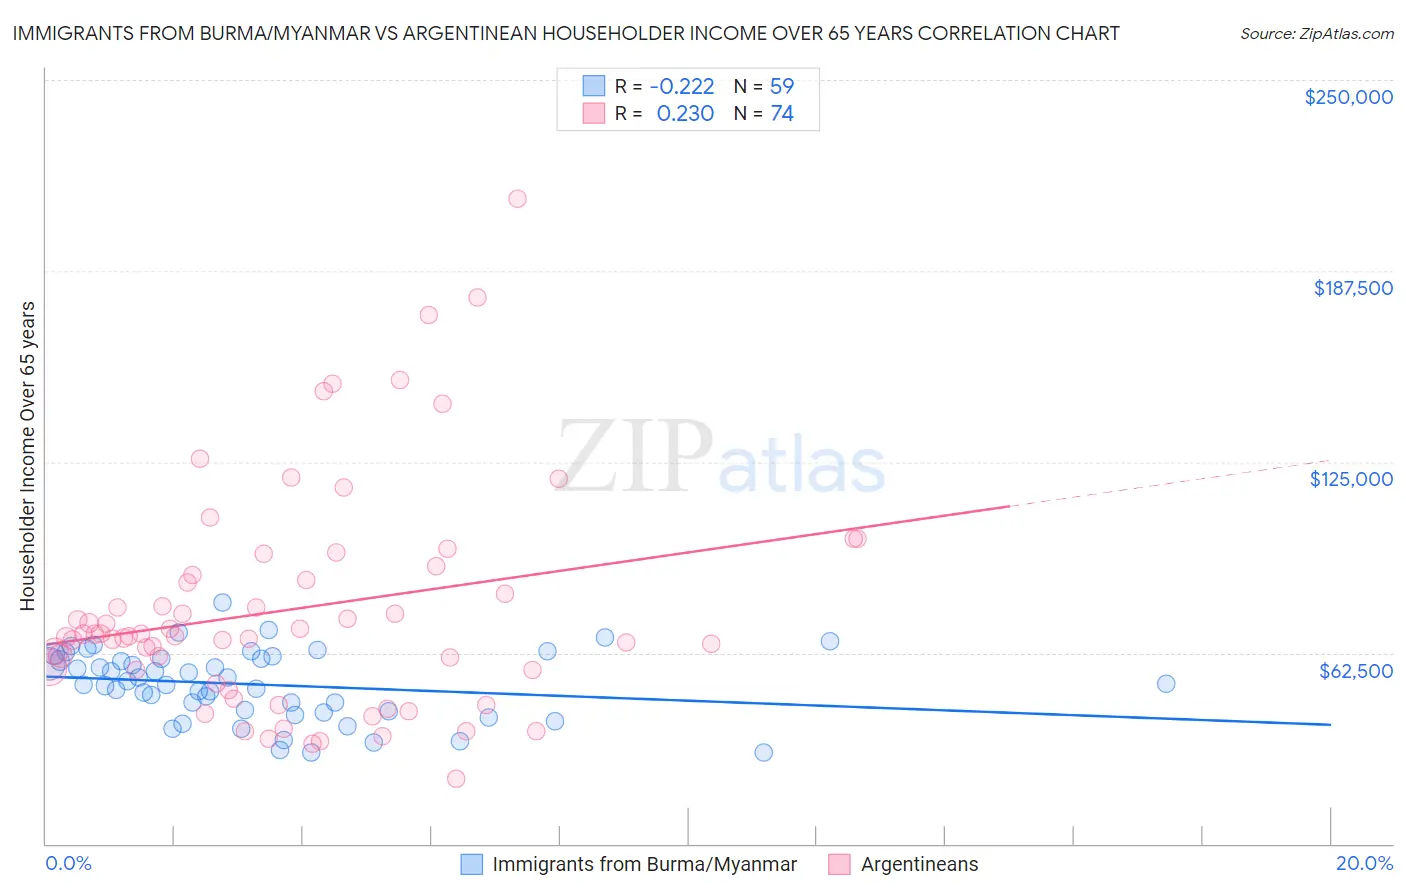
Immigrants from Burma/Myanmar vs Argentinean Householder Income Over 65 years Correlation Chart
The statistical analysis conducted on geographies consisting of 172,033,501 people shows a weak negative correlation between the proportion of Immigrants from Burma/Myanmar and household income with householder over the age of 65 in the United States with a correlation coefficient (R) of -0.222 and weighted average of $57,114. Similarly, the statistical analysis conducted on geographies consisting of 296,532,812 people shows a weak positive correlation between the proportion of Argentineans and household income with householder over the age of 65 in the United States with a correlation coefficient (R) of 0.230 and weighted average of $65,246, a difference of 14.2%.
Householder Income Over 65 years Correlation Summary
| Measurement | Immigrants from Burma/Myanmar | Argentinean |
| Minimum | $29,861 | $21,406 |
| Maximum | $78,969 | $211,250 |
| Range | $49,108 | $189,844 |
| Mean | $52,112 | $76,897 |
| Median | $52,321 | $68,316 |
| Interquartile 25% (IQ1) | $43,364 | $56,796 |
| Interquartile 75% (IQ3) | $60,699 | $87,790 |
| Interquartile Range (IQR) | $17,335 | $30,994 |
| Standard Deviation (Sample) | $11,315 | $36,797 |
| Standard Deviation (Population) | $11,219 | $36,547 |
Similar Demographics by Householder Income Over 65 years
Demographics Similar to Immigrants from Burma/Myanmar by Householder Income Over 65 years
In terms of householder income over 65 years, the demographic groups most similar to Immigrants from Burma/Myanmar are Immigrants from Western Africa ($57,119, a difference of 0.010%), Spanish American ($57,021, a difference of 0.16%), Immigrants from Uruguay ($56,975, a difference of 0.24%), Immigrants from Panama ($56,944, a difference of 0.30%), and Immigrants from Venezuela ($57,371, a difference of 0.45%).
| Demographics | Rating | Rank | Householder Income Over 65 years |
| Japanese | 3.9 /100 | #227 | Tragic $57,919 |
| Immigrants | Albania | 3.6 /100 | #228 | Tragic $57,828 |
| Immigrants | Colombia | 3.0 /100 | #229 | Tragic $57,658 |
| Immigrants | Cambodia | 2.8 /100 | #230 | Tragic $57,580 |
| Immigrants | Nonimmigrants | 2.4 /100 | #231 | Tragic $57,426 |
| Immigrants | Venezuela | 2.3 /100 | #232 | Tragic $57,371 |
| Immigrants | Western Africa | 1.7 /100 | #233 | Tragic $57,119 |
| Immigrants | Burma/Myanmar | 1.7 /100 | #234 | Tragic $57,114 |
| Spanish Americans | 1.6 /100 | #235 | Tragic $57,021 |
| Immigrants | Uruguay | 1.5 /100 | #236 | Tragic $56,975 |
| Immigrants | Panama | 1.5 /100 | #237 | Tragic $56,944 |
| Fijians | 1.2 /100 | #238 | Tragic $56,768 |
| Immigrants | Laos | 1.2 /100 | #239 | Tragic $56,722 |
| Sub-Saharan Africans | 1.0 /100 | #240 | Tragic $56,615 |
| Immigrants | Guyana | 0.9 /100 | #241 | Tragic $56,495 |
Demographics Similar to Argentineans by Householder Income Over 65 years
In terms of householder income over 65 years, the demographic groups most similar to Argentineans are Immigrants from Ethiopia ($65,238, a difference of 0.010%), Lithuanian ($65,209, a difference of 0.060%), Greek ($65,306, a difference of 0.090%), Mongolian ($65,326, a difference of 0.12%), and Samoan ($65,427, a difference of 0.28%).
| Demographics | Rating | Rank | Householder Income Over 65 years |
| Immigrants | England | 99.3 /100 | #65 | Exceptional $65,715 |
| South Africans | 99.3 /100 | #66 | Exceptional $65,652 |
| Immigrants | Malaysia | 99.1 /100 | #67 | Exceptional $65,497 |
| Egyptians | 99.1 /100 | #68 | Exceptional $65,441 |
| Samoans | 99.1 /100 | #69 | Exceptional $65,427 |
| Mongolians | 99.0 /100 | #70 | Exceptional $65,326 |
| Greeks | 98.9 /100 | #71 | Exceptional $65,306 |
| Argentineans | 98.9 /100 | #72 | Exceptional $65,246 |
| Immigrants | Ethiopia | 98.9 /100 | #73 | Exceptional $65,238 |
| Lithuanians | 98.8 /100 | #74 | Exceptional $65,209 |
| Sierra Leoneans | 98.6 /100 | #75 | Exceptional $65,038 |
| Ethiopians | 98.5 /100 | #76 | Exceptional $64,989 |
| Immigrants | Canada | 98.5 /100 | #77 | Exceptional $64,952 |
| Immigrants | Western Europe | 98.5 /100 | #78 | Exceptional $64,933 |
| Hawaiians | 98.4 /100 | #79 | Exceptional $64,920 |