Immigrants from Bulgaria vs Armenian Median Household Income
COMPARE
Immigrants from Bulgaria
Armenian
Median Household Income
Median Household Income Comparison
Immigrants from Bulgaria
Armenians
$93,148
MEDIAN HOUSEHOLD INCOME
99.4/ 100
METRIC RATING
78th/ 347
METRIC RANK
$91,807
MEDIAN HOUSEHOLD INCOME
98.7/ 100
METRIC RATING
95th/ 347
METRIC RANK
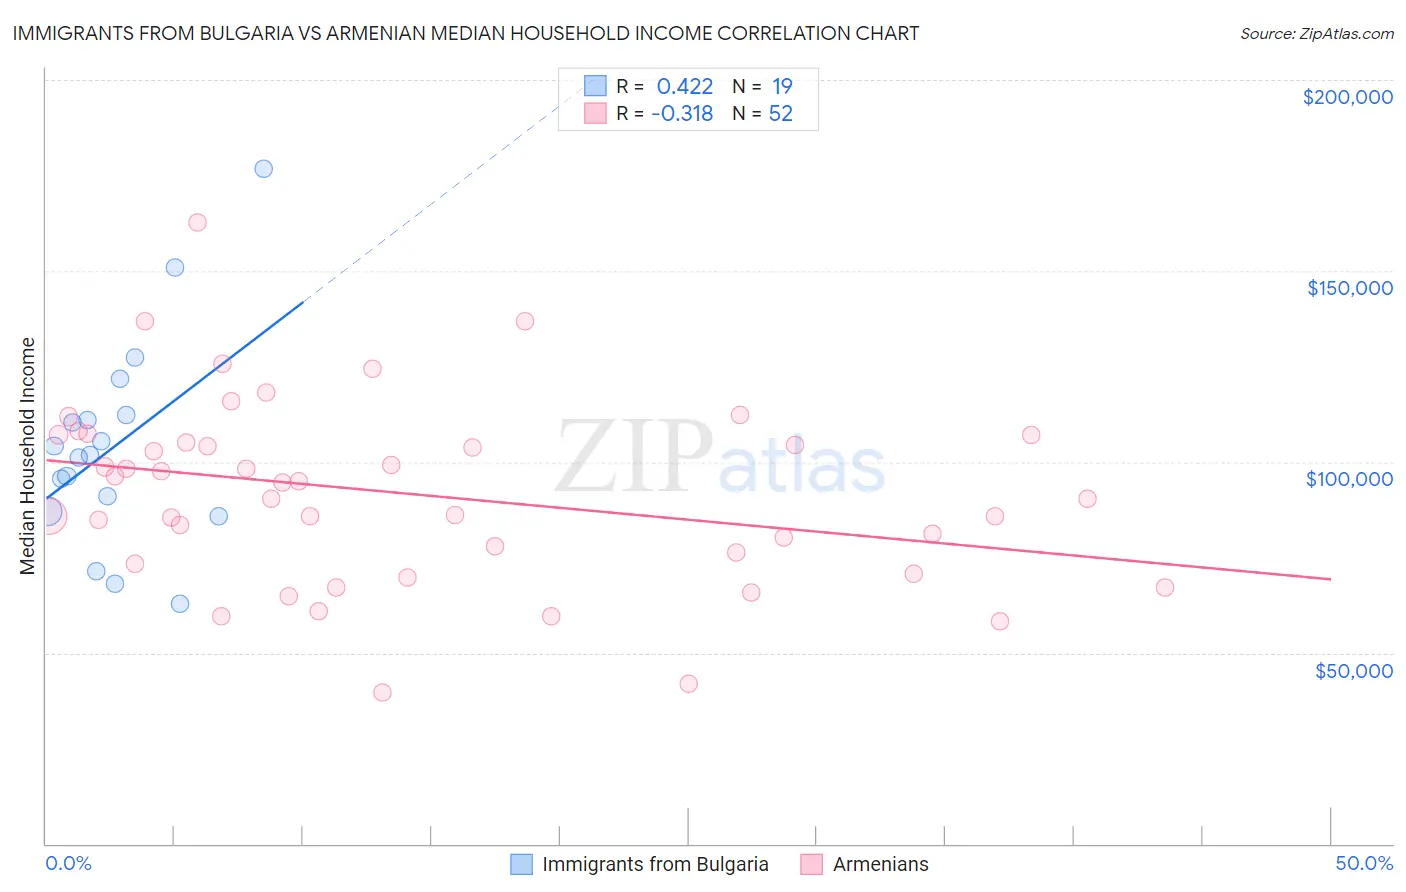
Immigrants from Bulgaria vs Armenian Median Household Income Correlation Chart
The statistical analysis conducted on geographies consisting of 172,532,880 people shows a moderate positive correlation between the proportion of Immigrants from Bulgaria and median household income in the United States with a correlation coefficient (R) of 0.422 and weighted average of $93,148. Similarly, the statistical analysis conducted on geographies consisting of 310,713,421 people shows a mild negative correlation between the proportion of Armenians and median household income in the United States with a correlation coefficient (R) of -0.318 and weighted average of $91,807, a difference of 1.5%.
Median Household Income Correlation Summary
| Measurement | Immigrants from Bulgaria | Armenian |
| Minimum | $62,888 | $39,713 |
| Maximum | $176,736 | $162,732 |
| Range | $113,848 | $123,019 |
| Mean | $104,276 | $91,613 |
| Median | $101,764 | $92,502 |
| Interquartile 25% (IQ1) | $87,129 | $74,815 |
| Interquartile 75% (IQ3) | $112,416 | $106,031 |
| Interquartile Range (IQR) | $25,288 | $31,215 |
| Standard Deviation (Sample) | $27,381 | $24,104 |
| Standard Deviation (Population) | $26,651 | $23,871 |
Demographics Similar to Immigrants from Bulgaria and Armenians by Median Household Income
In terms of median household income, the demographic groups most similar to Immigrants from Bulgaria are Sri Lankan ($93,093, a difference of 0.060%), Tongan ($93,076, a difference of 0.080%), Immigrants from Eastern Europe ($93,051, a difference of 0.10%), Immigrants from Afghanistan ($93,375, a difference of 0.24%), and South African ($93,379, a difference of 0.25%). Similarly, the demographic groups most similar to Armenians are Jordanian ($91,794, a difference of 0.010%), Immigrants from North America ($91,860, a difference of 0.060%), Immigrants from Lebanon ($91,887, a difference of 0.090%), Immigrants from Western Europe ($91,936, a difference of 0.14%), and Romanian ($91,994, a difference of 0.20%).
| Demographics | Rating | Rank | Median Household Income |
| South Africans | 99.5 /100 | #76 | Exceptional $93,379 |
| Immigrants | Afghanistan | 99.5 /100 | #77 | Exceptional $93,375 |
| Immigrants | Bulgaria | 99.4 /100 | #78 | Exceptional $93,148 |
| Sri Lankans | 99.4 /100 | #79 | Exceptional $93,093 |
| Tongans | 99.4 /100 | #80 | Exceptional $93,076 |
| Immigrants | Eastern Europe | 99.4 /100 | #81 | Exceptional $93,051 |
| Immigrants | Spain | 99.3 /100 | #82 | Exceptional $92,732 |
| Italians | 99.1 /100 | #83 | Exceptional $92,475 |
| Immigrants | Argentina | 99.1 /100 | #84 | Exceptional $92,417 |
| Immigrants | Croatia | 99.0 /100 | #85 | Exceptional $92,225 |
| Immigrants | England | 98.9 /100 | #86 | Exceptional $92,098 |
| Immigrants | Hungary | 98.9 /100 | #87 | Exceptional $92,094 |
| Immigrants | Canada | 98.8 /100 | #88 | Exceptional $92,029 |
| Romanians | 98.8 /100 | #89 | Exceptional $91,994 |
| Assyrians/Chaldeans/Syriacs | 98.8 /100 | #90 | Exceptional $91,991 |
| Immigrants | Vietnam | 98.8 /100 | #91 | Exceptional $91,987 |
| Immigrants | Western Europe | 98.8 /100 | #92 | Exceptional $91,936 |
| Immigrants | Lebanon | 98.7 /100 | #93 | Exceptional $91,887 |
| Immigrants | North America | 98.7 /100 | #94 | Exceptional $91,860 |
| Armenians | 98.7 /100 | #95 | Exceptional $91,807 |
| Jordanians | 98.7 /100 | #96 | Exceptional $91,794 |