Immigrants from Bosnia and Herzegovina vs Native/Alaskan Per Capita Income
COMPARE
Immigrants from Bosnia and Herzegovina
Native/Alaskan
Per Capita Income
Per Capita Income Comparison
Immigrants from Bosnia and Herzegovina
Natives/Alaskans
$42,278
PER CAPITA INCOME
17.5/ 100
METRIC RATING
202nd/ 347
METRIC RANK
$33,279
PER CAPITA INCOME
0.0/ 100
METRIC RATING
334th/ 347
METRIC RANK
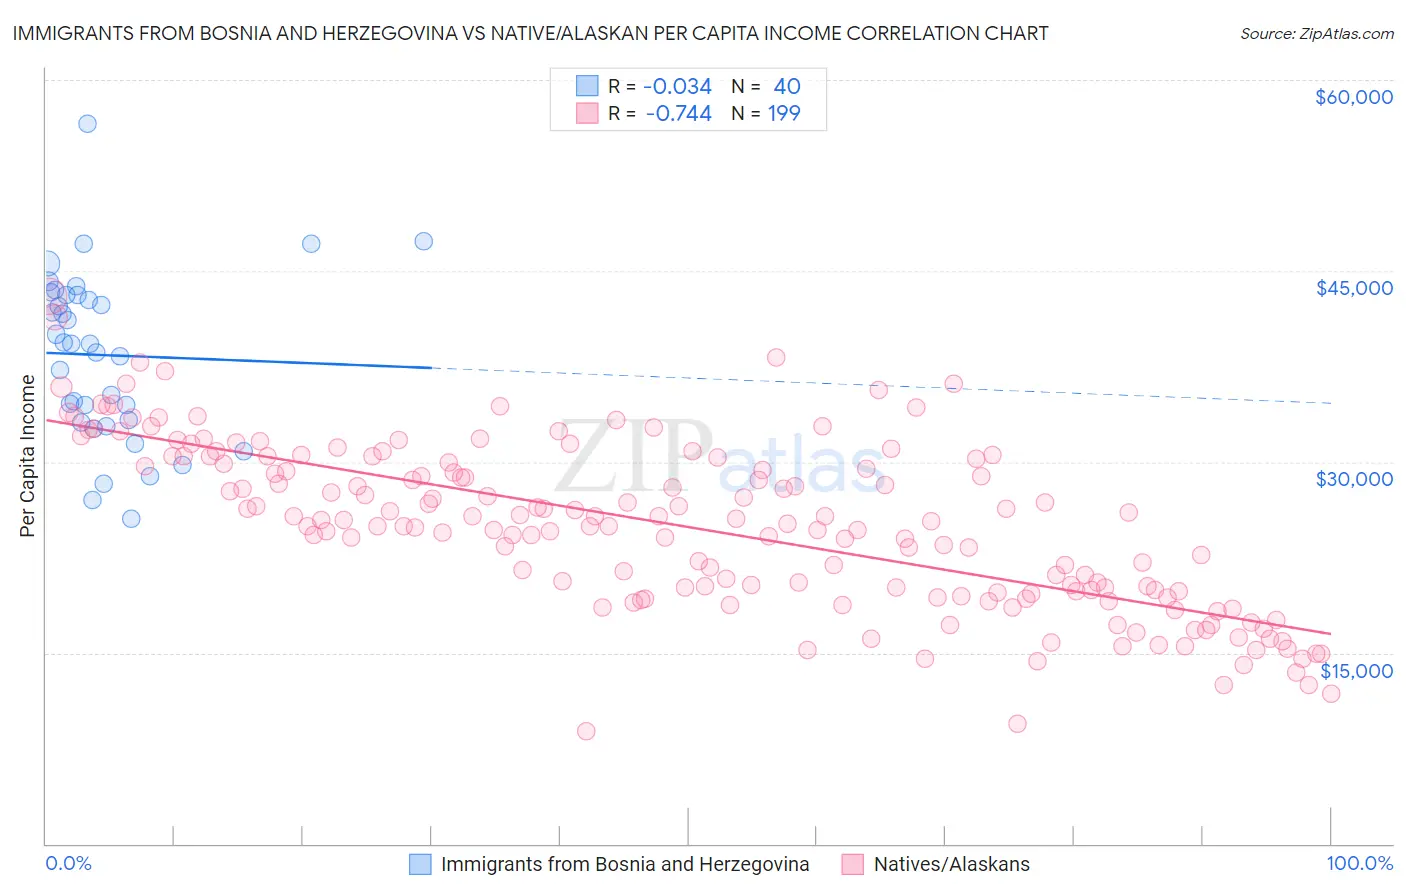
Immigrants from Bosnia and Herzegovina vs Native/Alaskan Per Capita Income Correlation Chart
The statistical analysis conducted on geographies consisting of 156,819,615 people shows no correlation between the proportion of Immigrants from Bosnia and Herzegovina and per capita income in the United States with a correlation coefficient (R) of -0.034 and weighted average of $42,278. Similarly, the statistical analysis conducted on geographies consisting of 513,079,708 people shows a strong negative correlation between the proportion of Natives/Alaskans and per capita income in the United States with a correlation coefficient (R) of -0.744 and weighted average of $33,279, a difference of 27.0%.
Per Capita Income Correlation Summary
| Measurement | Immigrants from Bosnia and Herzegovina | Native/Alaskan |
| Minimum | $25,485 | $8,837 |
| Maximum | $56,549 | $43,037 |
| Range | $31,064 | $34,200 |
| Mean | $38,380 | $24,883 |
| Median | $39,263 | $25,158 |
| Interquartile 25% (IQ1) | $33,229 | $19,735 |
| Interquartile 75% (IQ3) | $43,067 | $30,217 |
| Interquartile Range (IQR) | $9,838 | $10,482 |
| Standard Deviation (Sample) | $6,628 | $6,547 |
| Standard Deviation (Population) | $6,545 | $6,531 |
Similar Demographics by Per Capita Income
Demographics Similar to Immigrants from Bosnia and Herzegovina by Per Capita Income
In terms of per capita income, the demographic groups most similar to Immigrants from Bosnia and Herzegovina are Immigrants from Thailand ($42,289, a difference of 0.030%), Spanish ($42,249, a difference of 0.070%), Aleut ($42,210, a difference of 0.16%), Vietnamese ($42,368, a difference of 0.21%), and White/Caucasian ($42,180, a difference of 0.23%).
| Demographics | Rating | Rank | Per Capita Income |
| Immigrants | Kenya | 24.5 /100 | #195 | Fair $42,661 |
| Dutch | 23.4 /100 | #196 | Fair $42,605 |
| Scotch-Irish | 22.6 /100 | #197 | Fair $42,563 |
| Immigrants | Portugal | 19.7 /100 | #198 | Poor $42,412 |
| Barbadians | 19.6 /100 | #199 | Poor $42,406 |
| Vietnamese | 19.0 /100 | #200 | Poor $42,368 |
| Immigrants | Thailand | 17.6 /100 | #201 | Poor $42,289 |
| Immigrants | Bosnia and Herzegovina | 17.5 /100 | #202 | Poor $42,278 |
| Spanish | 17.0 /100 | #203 | Poor $42,249 |
| Aleuts | 16.4 /100 | #204 | Poor $42,210 |
| Whites/Caucasians | 15.9 /100 | #205 | Poor $42,180 |
| Ghanaians | 15.7 /100 | #206 | Poor $42,164 |
| Venezuelans | 14.4 /100 | #207 | Poor $42,074 |
| Panamanians | 13.9 /100 | #208 | Poor $42,035 |
| Immigrants | Sudan | 13.2 /100 | #209 | Poor $41,986 |
Demographics Similar to Natives/Alaskans by Per Capita Income
In terms of per capita income, the demographic groups most similar to Natives/Alaskans are Yuman ($33,236, a difference of 0.13%), Yakama ($33,009, a difference of 0.82%), Houma ($32,996, a difference of 0.86%), Immigrants from Yemen ($33,696, a difference of 1.3%), and Sioux ($33,921, a difference of 1.9%).
| Demographics | Rating | Rank | Per Capita Income |
| Apache | 0.0 /100 | #327 | Tragic $34,886 |
| Menominee | 0.0 /100 | #328 | Tragic $34,578 |
| Mexicans | 0.0 /100 | #329 | Tragic $34,559 |
| Spanish American Indians | 0.0 /100 | #330 | Tragic $34,195 |
| Immigrants | Mexico | 0.0 /100 | #331 | Tragic $33,931 |
| Sioux | 0.0 /100 | #332 | Tragic $33,921 |
| Immigrants | Yemen | 0.0 /100 | #333 | Tragic $33,696 |
| Natives/Alaskans | 0.0 /100 | #334 | Tragic $33,279 |
| Yuman | 0.0 /100 | #335 | Tragic $33,236 |
| Yakama | 0.0 /100 | #336 | Tragic $33,009 |
| Houma | 0.0 /100 | #337 | Tragic $32,996 |
| Arapaho | 0.0 /100 | #338 | Tragic $32,345 |
| Pueblo | 0.0 /100 | #339 | Tragic $32,012 |
| Crow | 0.0 /100 | #340 | Tragic $31,729 |
| Puerto Ricans | 0.0 /100 | #341 | Tragic $31,268 |