Immigrants from Bosnia and Herzegovina vs White/Caucasian Per Capita Income
COMPARE
Immigrants from Bosnia and Herzegovina
White/Caucasian
Per Capita Income
Per Capita Income Comparison
Immigrants from Bosnia and Herzegovina
Whites/Caucasians
$42,278
PER CAPITA INCOME
17.5/ 100
METRIC RATING
202nd/ 347
METRIC RANK
$42,180
PER CAPITA INCOME
15.9/ 100
METRIC RATING
205th/ 347
METRIC RANK
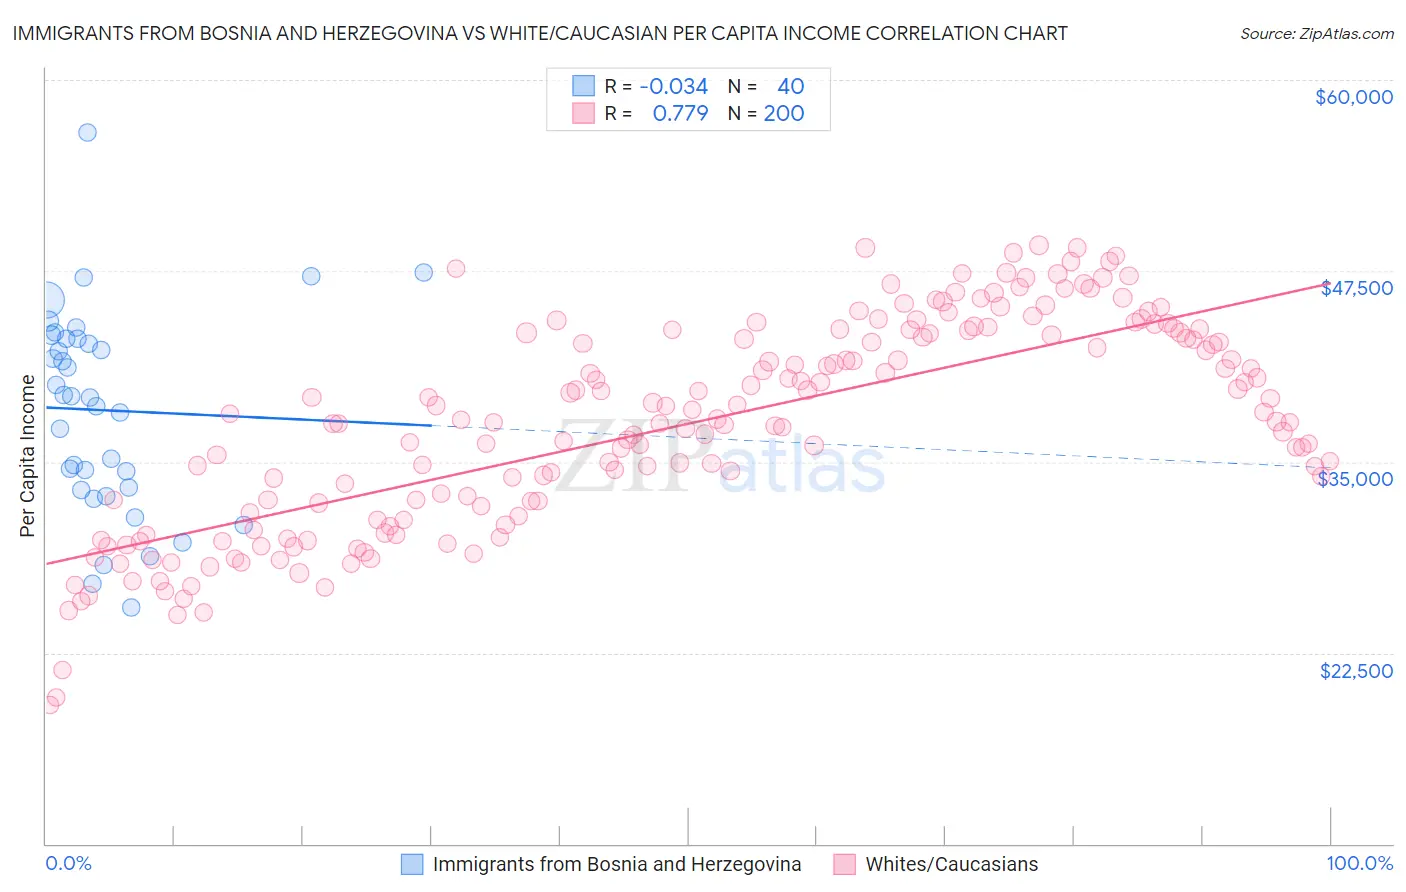
Immigrants from Bosnia and Herzegovina vs White/Caucasian Per Capita Income Correlation Chart
The statistical analysis conducted on geographies consisting of 156,819,615 people shows no correlation between the proportion of Immigrants from Bosnia and Herzegovina and per capita income in the United States with a correlation coefficient (R) of -0.034 and weighted average of $42,278. Similarly, the statistical analysis conducted on geographies consisting of 585,276,990 people shows a strong positive correlation between the proportion of Whites/Caucasians and per capita income in the United States with a correlation coefficient (R) of 0.779 and weighted average of $42,180, a difference of 0.23%.
Per Capita Income Correlation Summary
| Measurement | Immigrants from Bosnia and Herzegovina | White/Caucasian |
| Minimum | $25,485 | $19,081 |
| Maximum | $56,549 | $49,196 |
| Range | $31,064 | $30,115 |
| Mean | $38,380 | $37,504 |
| Median | $39,263 | $37,771 |
| Interquartile 25% (IQ1) | $33,229 | $31,862 |
| Interquartile 75% (IQ3) | $43,067 | $43,459 |
| Interquartile Range (IQR) | $9,838 | $11,597 |
| Standard Deviation (Sample) | $6,628 | $6,823 |
| Standard Deviation (Population) | $6,545 | $6,806 |
Demographics Similar to Immigrants from Bosnia and Herzegovina and Whites/Caucasians by Per Capita Income
In terms of per capita income, the demographic groups most similar to Immigrants from Bosnia and Herzegovina are Immigrants from Thailand ($42,289, a difference of 0.030%), Spanish ($42,249, a difference of 0.070%), Aleut ($42,210, a difference of 0.16%), Vietnamese ($42,368, a difference of 0.21%), and Ghanaian ($42,164, a difference of 0.27%). Similarly, the demographic groups most similar to Whites/Caucasians are Ghanaian ($42,164, a difference of 0.040%), Aleut ($42,210, a difference of 0.070%), Spanish ($42,249, a difference of 0.16%), Venezuelan ($42,074, a difference of 0.25%), and Immigrants from Thailand ($42,289, a difference of 0.26%).
| Demographics | Rating | Rank | Per Capita Income |
| Immigrants | Sierra Leone | 26.5 /100 | #193 | Fair $42,752 |
| Immigrants | Fiji | 25.2 /100 | #194 | Fair $42,694 |
| Immigrants | Kenya | 24.5 /100 | #195 | Fair $42,661 |
| Dutch | 23.4 /100 | #196 | Fair $42,605 |
| Scotch-Irish | 22.6 /100 | #197 | Fair $42,563 |
| Immigrants | Portugal | 19.7 /100 | #198 | Poor $42,412 |
| Barbadians | 19.6 /100 | #199 | Poor $42,406 |
| Vietnamese | 19.0 /100 | #200 | Poor $42,368 |
| Immigrants | Thailand | 17.6 /100 | #201 | Poor $42,289 |
| Immigrants | Bosnia and Herzegovina | 17.5 /100 | #202 | Poor $42,278 |
| Spanish | 17.0 /100 | #203 | Poor $42,249 |
| Aleuts | 16.4 /100 | #204 | Poor $42,210 |
| Whites/Caucasians | 15.9 /100 | #205 | Poor $42,180 |
| Ghanaians | 15.7 /100 | #206 | Poor $42,164 |
| Venezuelans | 14.4 /100 | #207 | Poor $42,074 |
| Panamanians | 13.9 /100 | #208 | Poor $42,035 |
| Immigrants | Sudan | 13.2 /100 | #209 | Poor $41,986 |
| Ecuadorians | 12.9 /100 | #210 | Poor $41,958 |
| Immigrants | Panama | 11.6 /100 | #211 | Poor $41,853 |
| Immigrants | Senegal | 11.3 /100 | #212 | Poor $41,830 |
| Immigrants | Venezuela | 10.2 /100 | #213 | Poor $41,727 |