Immigrants from Bosnia and Herzegovina vs Immigrants from Scotland Per Capita Income
COMPARE
Immigrants from Bosnia and Herzegovina
Immigrants from Scotland
Per Capita Income
Per Capita Income Comparison
Immigrants from Bosnia and Herzegovina
Immigrants from Scotland
$42,278
PER CAPITA INCOME
17.5/ 100
METRIC RATING
202nd/ 347
METRIC RANK
$49,893
PER CAPITA INCOME
99.9/ 100
METRIC RATING
60th/ 347
METRIC RANK
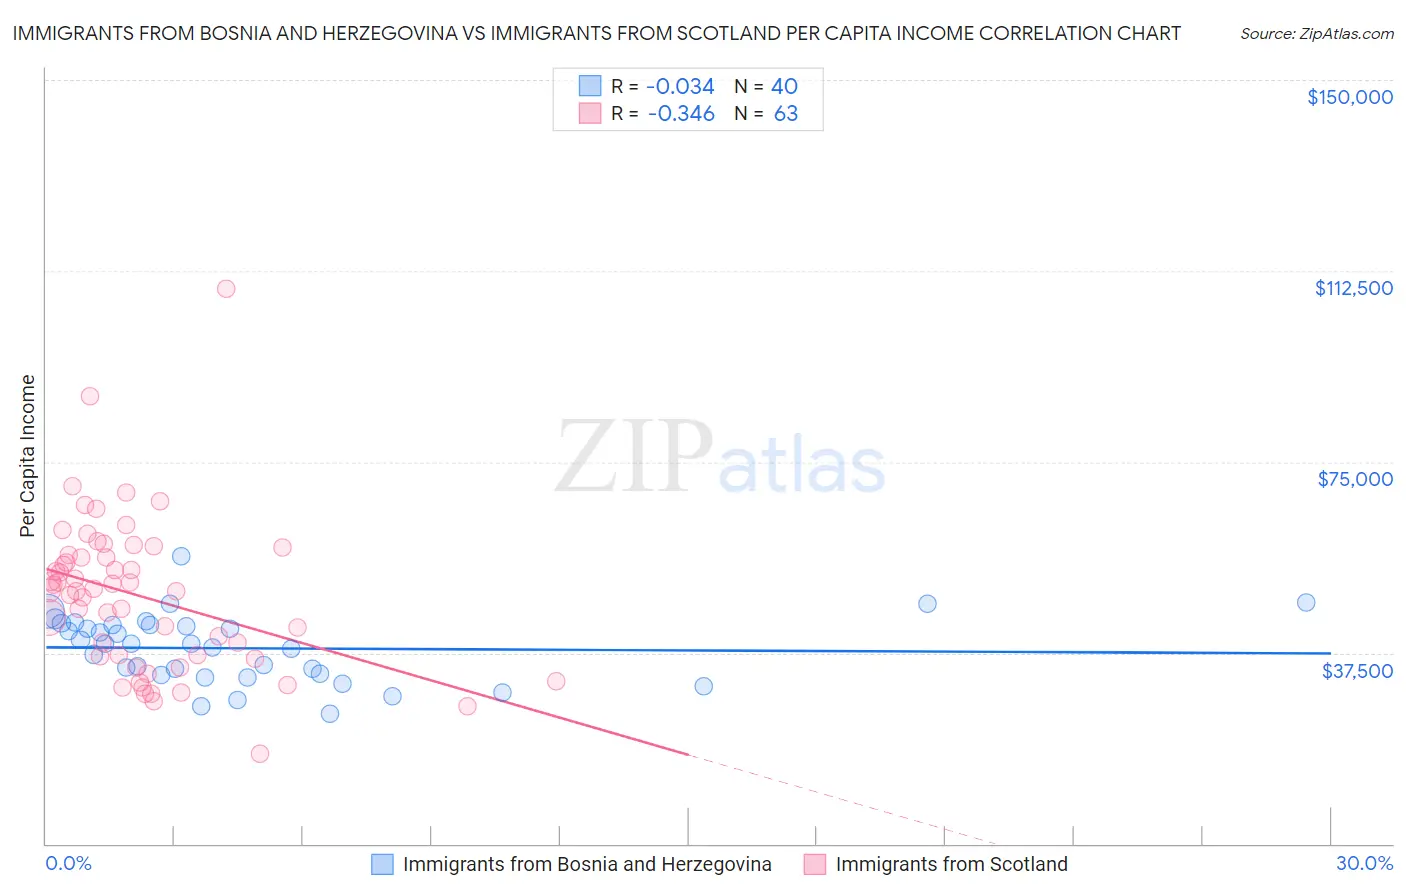
Immigrants from Bosnia and Herzegovina vs Immigrants from Scotland Per Capita Income Correlation Chart
The statistical analysis conducted on geographies consisting of 156,819,615 people shows no correlation between the proportion of Immigrants from Bosnia and Herzegovina and per capita income in the United States with a correlation coefficient (R) of -0.034 and weighted average of $42,278. Similarly, the statistical analysis conducted on geographies consisting of 196,392,396 people shows a mild negative correlation between the proportion of Immigrants from Scotland and per capita income in the United States with a correlation coefficient (R) of -0.346 and weighted average of $49,893, a difference of 18.0%.
Per Capita Income Correlation Summary
| Measurement | Immigrants from Bosnia and Herzegovina | Immigrants from Scotland |
| Minimum | $25,485 | $17,665 |
| Maximum | $56,549 | $108,962 |
| Range | $31,064 | $91,297 |
| Mean | $38,380 | $48,673 |
| Median | $39,263 | $49,771 |
| Interquartile 25% (IQ1) | $33,229 | $36,731 |
| Interquartile 75% (IQ3) | $43,067 | $56,663 |
| Interquartile Range (IQR) | $9,838 | $19,932 |
| Standard Deviation (Sample) | $6,628 | $15,263 |
| Standard Deviation (Population) | $6,545 | $15,141 |
Similar Demographics by Per Capita Income
Demographics Similar to Immigrants from Bosnia and Herzegovina by Per Capita Income
In terms of per capita income, the demographic groups most similar to Immigrants from Bosnia and Herzegovina are Immigrants from Thailand ($42,289, a difference of 0.030%), Spanish ($42,249, a difference of 0.070%), Aleut ($42,210, a difference of 0.16%), Vietnamese ($42,368, a difference of 0.21%), and White/Caucasian ($42,180, a difference of 0.23%).
| Demographics | Rating | Rank | Per Capita Income |
| Immigrants | Kenya | 24.5 /100 | #195 | Fair $42,661 |
| Dutch | 23.4 /100 | #196 | Fair $42,605 |
| Scotch-Irish | 22.6 /100 | #197 | Fair $42,563 |
| Immigrants | Portugal | 19.7 /100 | #198 | Poor $42,412 |
| Barbadians | 19.6 /100 | #199 | Poor $42,406 |
| Vietnamese | 19.0 /100 | #200 | Poor $42,368 |
| Immigrants | Thailand | 17.6 /100 | #201 | Poor $42,289 |
| Immigrants | Bosnia and Herzegovina | 17.5 /100 | #202 | Poor $42,278 |
| Spanish | 17.0 /100 | #203 | Poor $42,249 |
| Aleuts | 16.4 /100 | #204 | Poor $42,210 |
| Whites/Caucasians | 15.9 /100 | #205 | Poor $42,180 |
| Ghanaians | 15.7 /100 | #206 | Poor $42,164 |
| Venezuelans | 14.4 /100 | #207 | Poor $42,074 |
| Panamanians | 13.9 /100 | #208 | Poor $42,035 |
| Immigrants | Sudan | 13.2 /100 | #209 | Poor $41,986 |
Demographics Similar to Immigrants from Scotland by Per Capita Income
In terms of per capita income, the demographic groups most similar to Immigrants from Scotland are Bhutanese ($49,894, a difference of 0.0%), Argentinean ($49,862, a difference of 0.060%), Immigrants from Malaysia ($49,983, a difference of 0.18%), South African ($50,044, a difference of 0.30%), and Immigrants from Asia ($49,741, a difference of 0.31%).
| Demographics | Rating | Rank | Per Capita Income |
| Paraguayans | 99.9 /100 | #53 | Exceptional $50,385 |
| Immigrants | Belarus | 99.9 /100 | #54 | Exceptional $50,303 |
| Immigrants | Western Europe | 99.9 /100 | #55 | Exceptional $50,065 |
| Asians | 99.9 /100 | #56 | Exceptional $50,057 |
| South Africans | 99.9 /100 | #57 | Exceptional $50,044 |
| Immigrants | Malaysia | 99.9 /100 | #58 | Exceptional $49,983 |
| Bhutanese | 99.9 /100 | #59 | Exceptional $49,894 |
| Immigrants | Scotland | 99.9 /100 | #60 | Exceptional $49,893 |
| Argentineans | 99.9 /100 | #61 | Exceptional $49,862 |
| Immigrants | Asia | 99.9 /100 | #62 | Exceptional $49,741 |
| Maltese | 99.9 /100 | #63 | Exceptional $49,640 |
| Immigrants | Argentina | 99.9 /100 | #64 | Exceptional $49,627 |
| Bolivians | 99.9 /100 | #65 | Exceptional $49,526 |
| Immigrants | Bulgaria | 99.9 /100 | #66 | Exceptional $49,482 |
| Immigrants | Romania | 99.9 /100 | #67 | Exceptional $49,463 |