Pakistani vs Native/Alaskan Per Capita Income
COMPARE
Pakistani
Native/Alaskan
Per Capita Income
Per Capita Income Comparison
Pakistanis
Natives/Alaskans
$45,587
PER CAPITA INCOME
89.7/ 100
METRIC RATING
133rd/ 347
METRIC RANK
$33,279
PER CAPITA INCOME
0.0/ 100
METRIC RATING
334th/ 347
METRIC RANK
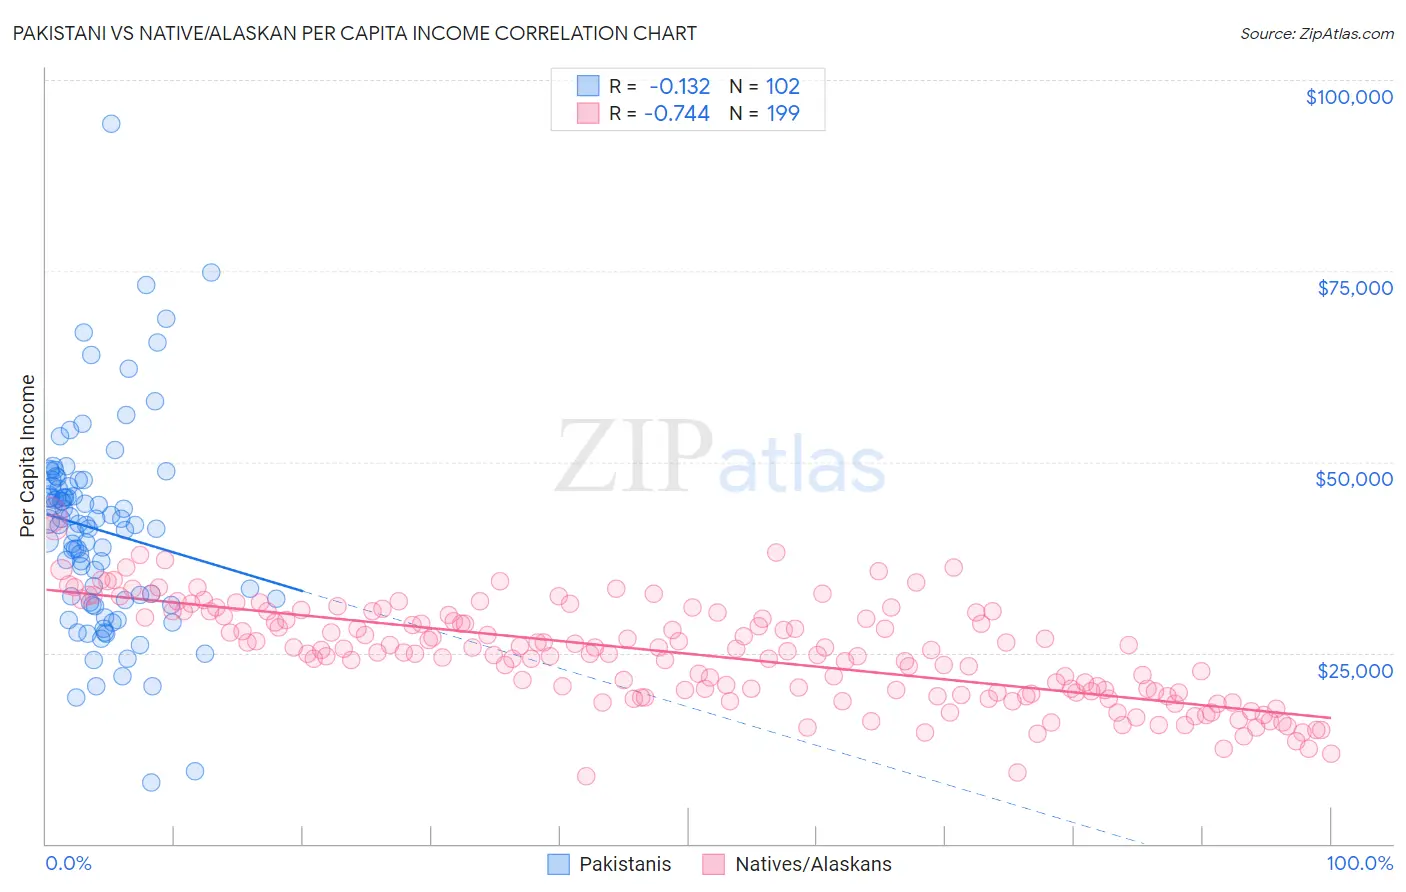
Pakistani vs Native/Alaskan Per Capita Income Correlation Chart
The statistical analysis conducted on geographies consisting of 335,371,609 people shows a poor negative correlation between the proportion of Pakistanis and per capita income in the United States with a correlation coefficient (R) of -0.132 and weighted average of $45,587. Similarly, the statistical analysis conducted on geographies consisting of 513,079,708 people shows a strong negative correlation between the proportion of Natives/Alaskans and per capita income in the United States with a correlation coefficient (R) of -0.744 and weighted average of $33,279, a difference of 37.0%.
Per Capita Income Correlation Summary
| Measurement | Pakistani | Native/Alaskan |
| Minimum | $8,026 | $8,837 |
| Maximum | $94,275 | $43,037 |
| Range | $86,249 | $34,200 |
| Mean | $41,080 | $24,883 |
| Median | $41,744 | $25,158 |
| Interquartile 25% (IQ1) | $31,965 | $19,735 |
| Interquartile 75% (IQ3) | $46,855 | $30,217 |
| Interquartile Range (IQR) | $14,890 | $10,482 |
| Standard Deviation (Sample) | $13,251 | $6,547 |
| Standard Deviation (Population) | $13,186 | $6,531 |
Similar Demographics by Per Capita Income
Demographics Similar to Pakistanis by Per Capita Income
In terms of per capita income, the demographic groups most similar to Pakistanis are Slovene ($45,581, a difference of 0.010%), Jordanian ($45,605, a difference of 0.040%), Immigrants from North Macedonia ($45,622, a difference of 0.080%), Arab ($45,662, a difference of 0.16%), and Luxembourger ($45,663, a difference of 0.17%).
| Demographics | Rating | Rank | Per Capita Income |
| Palestinians | 91.6 /100 | #126 | Exceptional $45,790 |
| Immigrants | Germany | 91.3 /100 | #127 | Exceptional $45,751 |
| Swedes | 91.3 /100 | #128 | Exceptional $45,750 |
| Luxembourgers | 90.4 /100 | #129 | Exceptional $45,663 |
| Arabs | 90.4 /100 | #130 | Exceptional $45,662 |
| Immigrants | North Macedonia | 90.0 /100 | #131 | Exceptional $45,622 |
| Jordanians | 89.9 /100 | #132 | Excellent $45,605 |
| Pakistanis | 89.7 /100 | #133 | Excellent $45,587 |
| Slovenes | 89.6 /100 | #134 | Excellent $45,581 |
| Hungarians | 87.9 /100 | #135 | Excellent $45,426 |
| Immigrants | Oceania | 85.2 /100 | #136 | Excellent $45,220 |
| Immigrants | Syria | 85.2 /100 | #137 | Excellent $45,218 |
| Assyrians/Chaldeans/Syriacs | 84.8 /100 | #138 | Excellent $45,195 |
| Basques | 83.2 /100 | #139 | Excellent $45,086 |
| Immigrants | Jordan | 82.9 /100 | #140 | Excellent $45,066 |
Demographics Similar to Natives/Alaskans by Per Capita Income
In terms of per capita income, the demographic groups most similar to Natives/Alaskans are Yuman ($33,236, a difference of 0.13%), Yakama ($33,009, a difference of 0.82%), Houma ($32,996, a difference of 0.86%), Immigrants from Yemen ($33,696, a difference of 1.3%), and Sioux ($33,921, a difference of 1.9%).
| Demographics | Rating | Rank | Per Capita Income |
| Apache | 0.0 /100 | #327 | Tragic $34,886 |
| Menominee | 0.0 /100 | #328 | Tragic $34,578 |
| Mexicans | 0.0 /100 | #329 | Tragic $34,559 |
| Spanish American Indians | 0.0 /100 | #330 | Tragic $34,195 |
| Immigrants | Mexico | 0.0 /100 | #331 | Tragic $33,931 |
| Sioux | 0.0 /100 | #332 | Tragic $33,921 |
| Immigrants | Yemen | 0.0 /100 | #333 | Tragic $33,696 |
| Natives/Alaskans | 0.0 /100 | #334 | Tragic $33,279 |
| Yuman | 0.0 /100 | #335 | Tragic $33,236 |
| Yakama | 0.0 /100 | #336 | Tragic $33,009 |
| Houma | 0.0 /100 | #337 | Tragic $32,996 |
| Arapaho | 0.0 /100 | #338 | Tragic $32,345 |
| Pueblo | 0.0 /100 | #339 | Tragic $32,012 |
| Crow | 0.0 /100 | #340 | Tragic $31,729 |
| Puerto Ricans | 0.0 /100 | #341 | Tragic $31,268 |