Immigrants from Sri Lanka vs Native/Alaskan Per Capita Income
COMPARE
Immigrants from Sri Lanka
Native/Alaskan
Per Capita Income
Per Capita Income Comparison
Immigrants from Sri Lanka
Natives/Alaskans
$50,555
PER CAPITA INCOME
100.0/ 100
METRIC RATING
50th/ 347
METRIC RANK
$33,279
PER CAPITA INCOME
0.0/ 100
METRIC RATING
334th/ 347
METRIC RANK
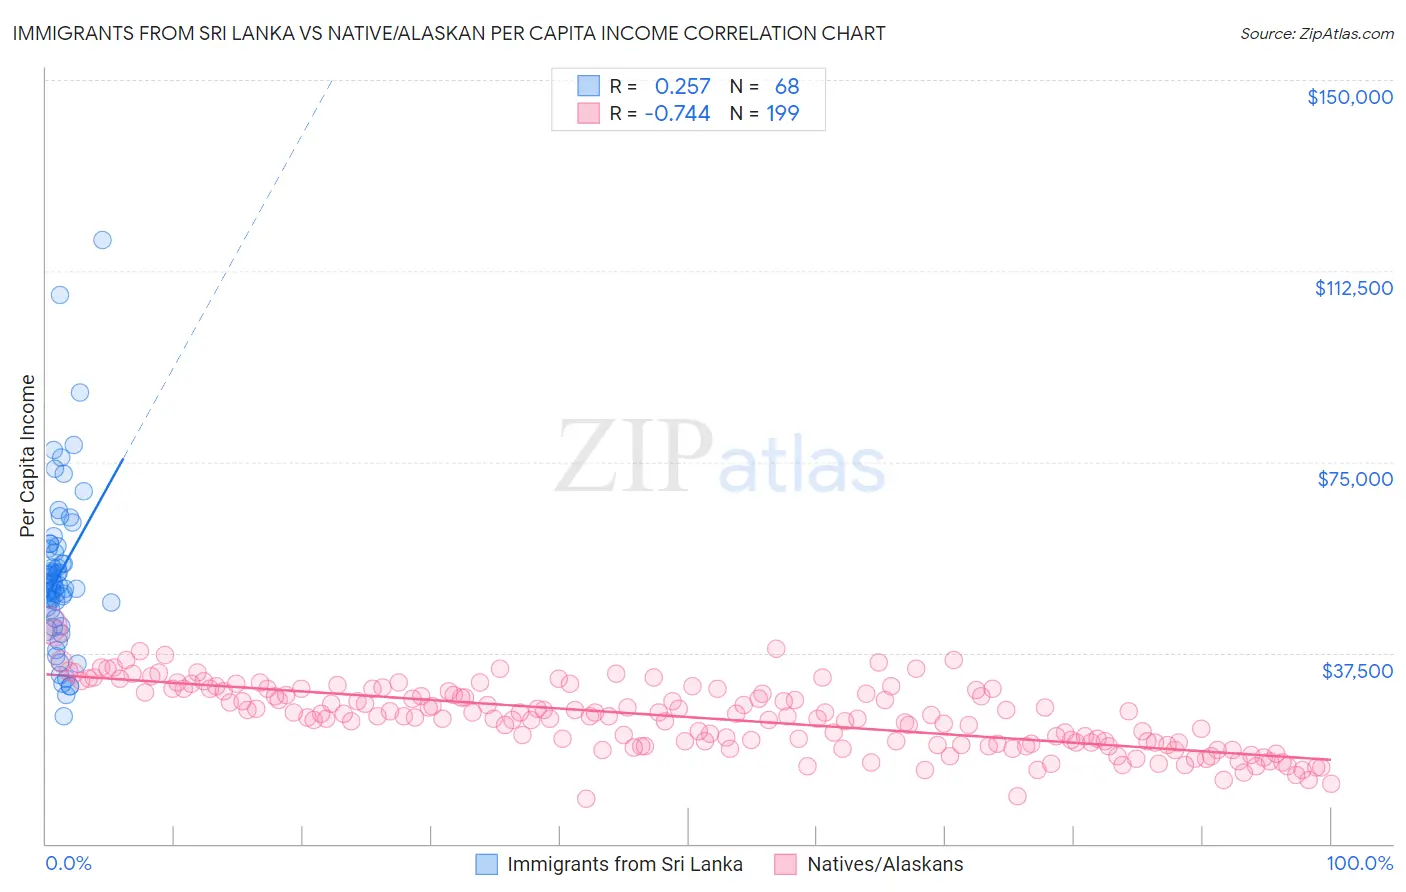
Immigrants from Sri Lanka vs Native/Alaskan Per Capita Income Correlation Chart
The statistical analysis conducted on geographies consisting of 149,699,244 people shows a weak positive correlation between the proportion of Immigrants from Sri Lanka and per capita income in the United States with a correlation coefficient (R) of 0.257 and weighted average of $50,555. Similarly, the statistical analysis conducted on geographies consisting of 513,079,708 people shows a strong negative correlation between the proportion of Natives/Alaskans and per capita income in the United States with a correlation coefficient (R) of -0.744 and weighted average of $33,279, a difference of 51.9%.
Per Capita Income Correlation Summary
| Measurement | Immigrants from Sri Lanka | Native/Alaskan |
| Minimum | $24,946 | $8,837 |
| Maximum | $118,591 | $43,037 |
| Range | $93,645 | $34,200 |
| Mean | $53,052 | $24,883 |
| Median | $50,889 | $25,158 |
| Interquartile 25% (IQ1) | $45,023 | $19,735 |
| Interquartile 75% (IQ3) | $58,187 | $30,217 |
| Interquartile Range (IQR) | $13,164 | $10,482 |
| Standard Deviation (Sample) | $16,356 | $6,547 |
| Standard Deviation (Population) | $16,236 | $6,531 |
Similar Demographics by Per Capita Income
Demographics Similar to Immigrants from Sri Lanka by Per Capita Income
In terms of per capita income, the demographic groups most similar to Immigrants from Sri Lanka are New Zealander ($50,575, a difference of 0.040%), Immigrants from Netherlands ($50,458, a difference of 0.19%), Immigrants from Croatia ($50,417, a difference of 0.27%), Paraguayan ($50,385, a difference of 0.34%), and Immigrants from Serbia ($50,810, a difference of 0.50%).
| Demographics | Rating | Rank | Per Capita Income |
| Immigrants | Lithuania | 100.0 /100 | #43 | Exceptional $51,361 |
| Immigrants | Europe | 100.0 /100 | #44 | Exceptional $50,950 |
| Immigrants | Spain | 100.0 /100 | #45 | Exceptional $50,933 |
| Immigrants | Latvia | 100.0 /100 | #46 | Exceptional $50,914 |
| Bulgarians | 100.0 /100 | #47 | Exceptional $50,906 |
| Immigrants | Serbia | 100.0 /100 | #48 | Exceptional $50,810 |
| New Zealanders | 100.0 /100 | #49 | Exceptional $50,575 |
| Immigrants | Sri Lanka | 100.0 /100 | #50 | Exceptional $50,555 |
| Immigrants | Netherlands | 100.0 /100 | #51 | Exceptional $50,458 |
| Immigrants | Croatia | 99.9 /100 | #52 | Exceptional $50,417 |
| Paraguayans | 99.9 /100 | #53 | Exceptional $50,385 |
| Immigrants | Belarus | 99.9 /100 | #54 | Exceptional $50,303 |
| Immigrants | Western Europe | 99.9 /100 | #55 | Exceptional $50,065 |
| Asians | 99.9 /100 | #56 | Exceptional $50,057 |
| South Africans | 99.9 /100 | #57 | Exceptional $50,044 |
Demographics Similar to Natives/Alaskans by Per Capita Income
In terms of per capita income, the demographic groups most similar to Natives/Alaskans are Yuman ($33,236, a difference of 0.13%), Yakama ($33,009, a difference of 0.82%), Houma ($32,996, a difference of 0.86%), Immigrants from Yemen ($33,696, a difference of 1.3%), and Sioux ($33,921, a difference of 1.9%).
| Demographics | Rating | Rank | Per Capita Income |
| Apache | 0.0 /100 | #327 | Tragic $34,886 |
| Menominee | 0.0 /100 | #328 | Tragic $34,578 |
| Mexicans | 0.0 /100 | #329 | Tragic $34,559 |
| Spanish American Indians | 0.0 /100 | #330 | Tragic $34,195 |
| Immigrants | Mexico | 0.0 /100 | #331 | Tragic $33,931 |
| Sioux | 0.0 /100 | #332 | Tragic $33,921 |
| Immigrants | Yemen | 0.0 /100 | #333 | Tragic $33,696 |
| Natives/Alaskans | 0.0 /100 | #334 | Tragic $33,279 |
| Yuman | 0.0 /100 | #335 | Tragic $33,236 |
| Yakama | 0.0 /100 | #336 | Tragic $33,009 |
| Houma | 0.0 /100 | #337 | Tragic $32,996 |
| Arapaho | 0.0 /100 | #338 | Tragic $32,345 |
| Pueblo | 0.0 /100 | #339 | Tragic $32,012 |
| Crow | 0.0 /100 | #340 | Tragic $31,729 |
| Puerto Ricans | 0.0 /100 | #341 | Tragic $31,268 |