Immigrants from Bosnia and Herzegovina vs Macedonian Per Capita Income
COMPARE
Immigrants from Bosnia and Herzegovina
Macedonian
Per Capita Income
Per Capita Income Comparison
Immigrants from Bosnia and Herzegovina
Macedonians
$42,278
PER CAPITA INCOME
17.5/ 100
METRIC RATING
202nd/ 347
METRIC RANK
$47,573
PER CAPITA INCOME
98.8/ 100
METRIC RATING
91st/ 347
METRIC RANK
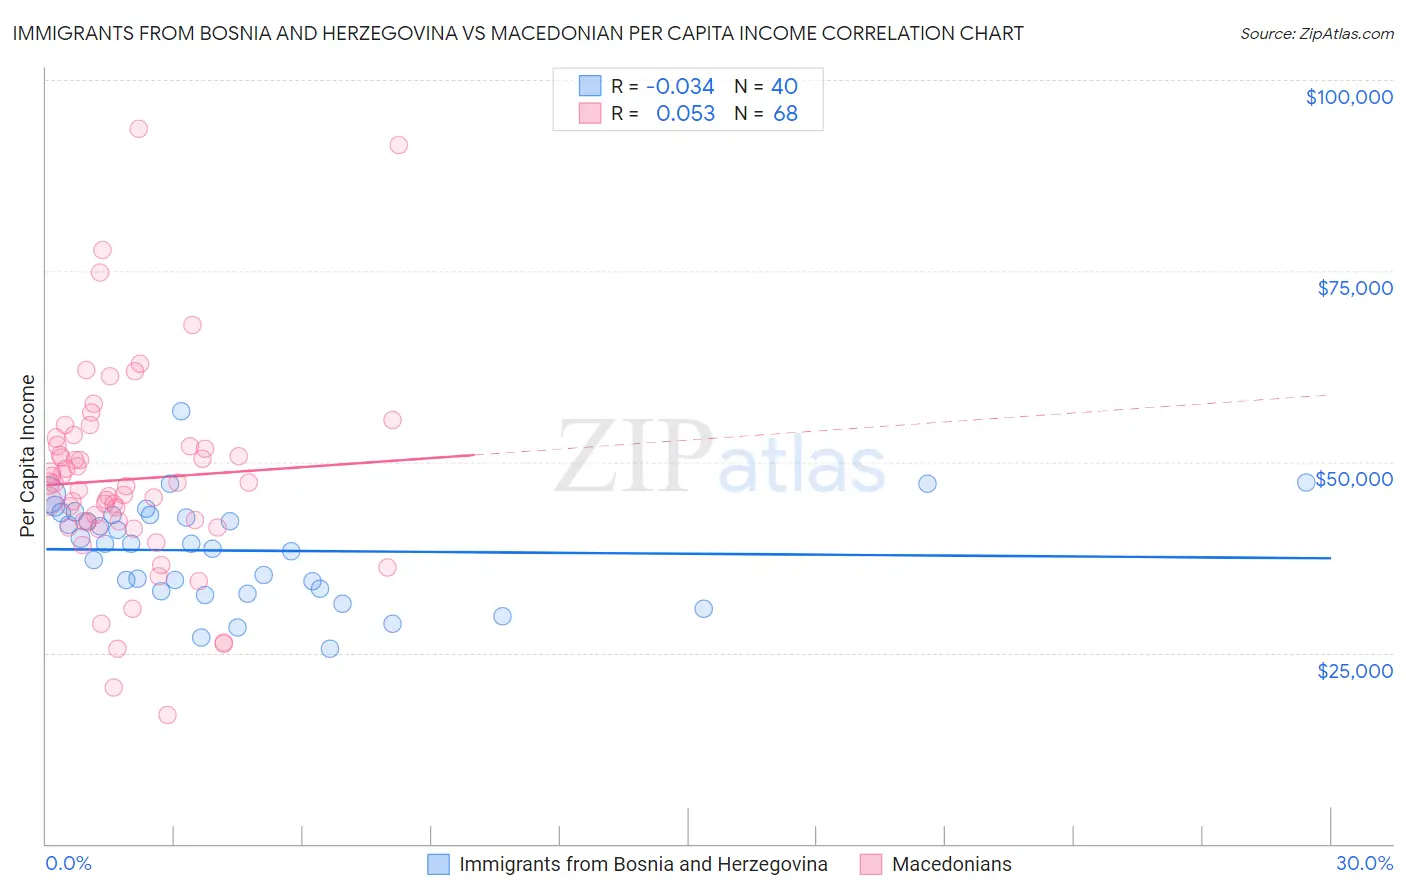
Immigrants from Bosnia and Herzegovina vs Macedonian Per Capita Income Correlation Chart
The statistical analysis conducted on geographies consisting of 156,819,615 people shows no correlation between the proportion of Immigrants from Bosnia and Herzegovina and per capita income in the United States with a correlation coefficient (R) of -0.034 and weighted average of $42,278. Similarly, the statistical analysis conducted on geographies consisting of 132,587,632 people shows a slight positive correlation between the proportion of Macedonians and per capita income in the United States with a correlation coefficient (R) of 0.053 and weighted average of $47,573, a difference of 12.5%.
Per Capita Income Correlation Summary
| Measurement | Immigrants from Bosnia and Herzegovina | Macedonian |
| Minimum | $25,485 | $16,916 |
| Maximum | $56,549 | $93,662 |
| Range | $31,064 | $76,746 |
| Mean | $38,380 | $47,728 |
| Median | $39,263 | $46,977 |
| Interquartile 25% (IQ1) | $33,229 | $41,808 |
| Interquartile 75% (IQ3) | $43,067 | $52,108 |
| Interquartile Range (IQR) | $9,838 | $10,300 |
| Standard Deviation (Sample) | $6,628 | $13,530 |
| Standard Deviation (Population) | $6,545 | $13,431 |
Similar Demographics by Per Capita Income
Demographics Similar to Immigrants from Bosnia and Herzegovina by Per Capita Income
In terms of per capita income, the demographic groups most similar to Immigrants from Bosnia and Herzegovina are Immigrants from Thailand ($42,289, a difference of 0.030%), Spanish ($42,249, a difference of 0.070%), Aleut ($42,210, a difference of 0.16%), Vietnamese ($42,368, a difference of 0.21%), and White/Caucasian ($42,180, a difference of 0.23%).
| Demographics | Rating | Rank | Per Capita Income |
| Immigrants | Kenya | 24.5 /100 | #195 | Fair $42,661 |
| Dutch | 23.4 /100 | #196 | Fair $42,605 |
| Scotch-Irish | 22.6 /100 | #197 | Fair $42,563 |
| Immigrants | Portugal | 19.7 /100 | #198 | Poor $42,412 |
| Barbadians | 19.6 /100 | #199 | Poor $42,406 |
| Vietnamese | 19.0 /100 | #200 | Poor $42,368 |
| Immigrants | Thailand | 17.6 /100 | #201 | Poor $42,289 |
| Immigrants | Bosnia and Herzegovina | 17.5 /100 | #202 | Poor $42,278 |
| Spanish | 17.0 /100 | #203 | Poor $42,249 |
| Aleuts | 16.4 /100 | #204 | Poor $42,210 |
| Whites/Caucasians | 15.9 /100 | #205 | Poor $42,180 |
| Ghanaians | 15.7 /100 | #206 | Poor $42,164 |
| Venezuelans | 14.4 /100 | #207 | Poor $42,074 |
| Panamanians | 13.9 /100 | #208 | Poor $42,035 |
| Immigrants | Sudan | 13.2 /100 | #209 | Poor $41,986 |
Demographics Similar to Macedonians by Per Capita Income
In terms of per capita income, the demographic groups most similar to Macedonians are Italian ($47,574, a difference of 0.0%), Immigrants from Moldova ($47,489, a difference of 0.18%), Northern European ($47,698, a difference of 0.26%), Croatian ($47,742, a difference of 0.36%), and Immigrants from Zimbabwe ($47,394, a difference of 0.38%).
| Demographics | Rating | Rank | Per Capita Income |
| Immigrants | Ukraine | 99.3 /100 | #84 | Exceptional $48,134 |
| Austrians | 99.3 /100 | #85 | Exceptional $48,116 |
| Immigrants | Southern Europe | 99.3 /100 | #86 | Exceptional $48,027 |
| Ukrainians | 99.3 /100 | #87 | Exceptional $48,014 |
| Croatians | 99.0 /100 | #88 | Exceptional $47,742 |
| Northern Europeans | 98.9 /100 | #89 | Exceptional $47,698 |
| Italians | 98.8 /100 | #90 | Exceptional $47,574 |
| Macedonians | 98.8 /100 | #91 | Exceptional $47,573 |
| Immigrants | Moldova | 98.7 /100 | #92 | Exceptional $47,489 |
| Immigrants | Zimbabwe | 98.5 /100 | #93 | Exceptional $47,394 |
| Albanians | 98.5 /100 | #94 | Exceptional $47,379 |
| Immigrants | Egypt | 98.5 /100 | #95 | Exceptional $47,361 |
| Alsatians | 98.3 /100 | #96 | Exceptional $47,284 |
| Carpatho Rusyns | 98.2 /100 | #97 | Exceptional $47,248 |
| Immigrants | Pakistan | 97.9 /100 | #98 | Exceptional $47,084 |