Immigrants from Bosnia and Herzegovina vs Native/Alaskan Householder Income Ages 25 - 44 years
COMPARE
Immigrants from Bosnia and Herzegovina
Native/Alaskan
Householder Income Ages 25 - 44 years
Householder Income Ages 25 - 44 years Comparison
Immigrants from Bosnia and Herzegovina
Natives/Alaskans
$88,819
HOUSEHOLDER INCOME AGES 25 - 44 YEARS
4.0/ 100
METRIC RATING
228th/ 347
METRIC RANK
$75,647
HOUSEHOLDER INCOME AGES 25 - 44 YEARS
0.0/ 100
METRIC RATING
331st/ 347
METRIC RANK
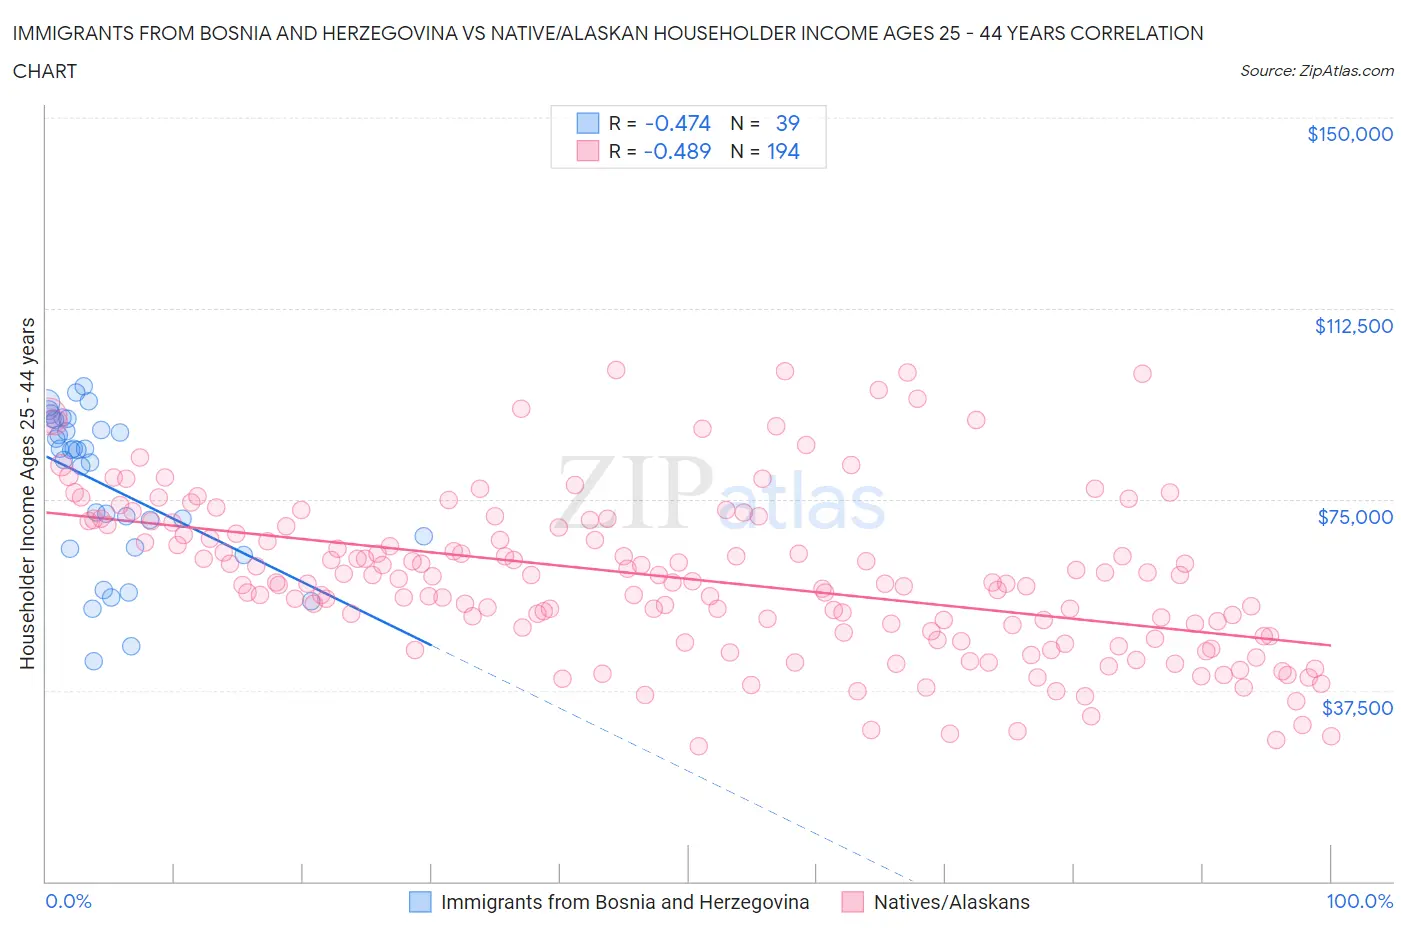
Immigrants from Bosnia and Herzegovina vs Native/Alaskan Householder Income Ages 25 - 44 years Correlation Chart
The statistical analysis conducted on geographies consisting of 156,745,458 people shows a moderate negative correlation between the proportion of Immigrants from Bosnia and Herzegovina and household income with householder between the ages 25 and 44 in the United States with a correlation coefficient (R) of -0.474 and weighted average of $88,819. Similarly, the statistical analysis conducted on geographies consisting of 509,973,002 people shows a moderate negative correlation between the proportion of Natives/Alaskans and household income with householder between the ages 25 and 44 in the United States with a correlation coefficient (R) of -0.489 and weighted average of $75,647, a difference of 17.4%.
Householder Income Ages 25 - 44 years Correlation Summary
| Measurement | Immigrants from Bosnia and Herzegovina | Native/Alaskan |
| Minimum | $43,125 | $26,585 |
| Maximum | $97,331 | $100,355 |
| Range | $54,206 | $73,770 |
| Mean | $77,653 | $59,417 |
| Median | $84,682 | $58,652 |
| Interquartile 25% (IQ1) | $65,598 | $48,151 |
| Interquartile 75% (IQ3) | $90,547 | $69,627 |
| Interquartile Range (IQR) | $24,949 | $21,476 |
| Standard Deviation (Sample) | $15,061 | $15,647 |
| Standard Deviation (Population) | $14,867 | $15,607 |
Similar Demographics by Householder Income Ages 25 - 44 years
Demographics Similar to Immigrants from Bosnia and Herzegovina by Householder Income Ages 25 - 44 years
In terms of householder income ages 25 - 44 years, the demographic groups most similar to Immigrants from Bosnia and Herzegovina are Immigrants from St. Vincent and the Grenadines ($88,888, a difference of 0.080%), Immigrants from Barbados ($88,687, a difference of 0.15%), Alaskan Athabascan ($88,446, a difference of 0.42%), Immigrants from Grenada ($88,311, a difference of 0.58%), and Nonimmigrants ($88,301, a difference of 0.59%).
| Demographics | Rating | Rank | Householder Income Ages 25 - 44 years |
| Immigrants | Trinidad and Tobago | 6.5 /100 | #221 | Tragic $89,748 |
| Immigrants | Ecuador | 6.2 /100 | #222 | Tragic $89,673 |
| Immigrants | Guyana | 5.9 /100 | #223 | Tragic $89,586 |
| Barbadians | 5.9 /100 | #224 | Tragic $89,565 |
| Immigrants | Panama | 5.5 /100 | #225 | Tragic $89,451 |
| Immigrants | Iraq | 5.5 /100 | #226 | Tragic $89,444 |
| Immigrants | St. Vincent and the Grenadines | 4.1 /100 | #227 | Tragic $88,888 |
| Immigrants | Bosnia and Herzegovina | 4.0 /100 | #228 | Tragic $88,819 |
| Immigrants | Barbados | 3.7 /100 | #229 | Tragic $88,687 |
| Alaskan Athabascans | 3.3 /100 | #230 | Tragic $88,446 |
| Immigrants | Grenada | 3.0 /100 | #231 | Tragic $88,311 |
| Immigrants | Nonimmigrants | 3.0 /100 | #232 | Tragic $88,301 |
| Malaysians | 3.0 /100 | #233 | Tragic $88,291 |
| Venezuelans | 2.9 /100 | #234 | Tragic $88,232 |
| Bermudans | 2.9 /100 | #235 | Tragic $88,231 |
Demographics Similar to Natives/Alaskans by Householder Income Ages 25 - 44 years
In terms of householder income ages 25 - 44 years, the demographic groups most similar to Natives/Alaskans are Bahamian ($75,395, a difference of 0.34%), Yakama ($76,226, a difference of 0.76%), Hopi ($75,002, a difference of 0.86%), Creek ($74,847, a difference of 1.1%), and Kiowa ($74,776, a difference of 1.2%).
| Demographics | Rating | Rank | Householder Income Ages 25 - 44 years |
| Dutch West Indians | 0.0 /100 | #324 | Tragic $77,260 |
| Sioux | 0.0 /100 | #325 | Tragic $77,089 |
| Houma | 0.0 /100 | #326 | Tragic $77,044 |
| Immigrants | Bahamas | 0.0 /100 | #327 | Tragic $76,910 |
| Immigrants | Cuba | 0.0 /100 | #328 | Tragic $76,701 |
| Seminole | 0.0 /100 | #329 | Tragic $76,584 |
| Yakama | 0.0 /100 | #330 | Tragic $76,226 |
| Natives/Alaskans | 0.0 /100 | #331 | Tragic $75,647 |
| Bahamians | 0.0 /100 | #332 | Tragic $75,395 |
| Hopi | 0.0 /100 | #333 | Tragic $75,002 |
| Creek | 0.0 /100 | #334 | Tragic $74,847 |
| Kiowa | 0.0 /100 | #335 | Tragic $74,776 |
| Yup'ik | 0.0 /100 | #336 | Tragic $73,688 |
| Blacks/African Americans | 0.0 /100 | #337 | Tragic $73,370 |
| Immigrants | Yemen | 0.0 /100 | #338 | Tragic $73,043 |