Immigrants from Bolivia vs Yugoslavian Per Capita Income
COMPARE
Immigrants from Bolivia
Yugoslavian
Per Capita Income
Per Capita Income Comparison
Immigrants from Bolivia
Yugoslavians
$48,970
PER CAPITA INCOME
99.7/ 100
METRIC RATING
75th/ 347
METRIC RANK
$42,792
PER CAPITA INCOME
27.4/ 100
METRIC RATING
191st/ 347
METRIC RANK
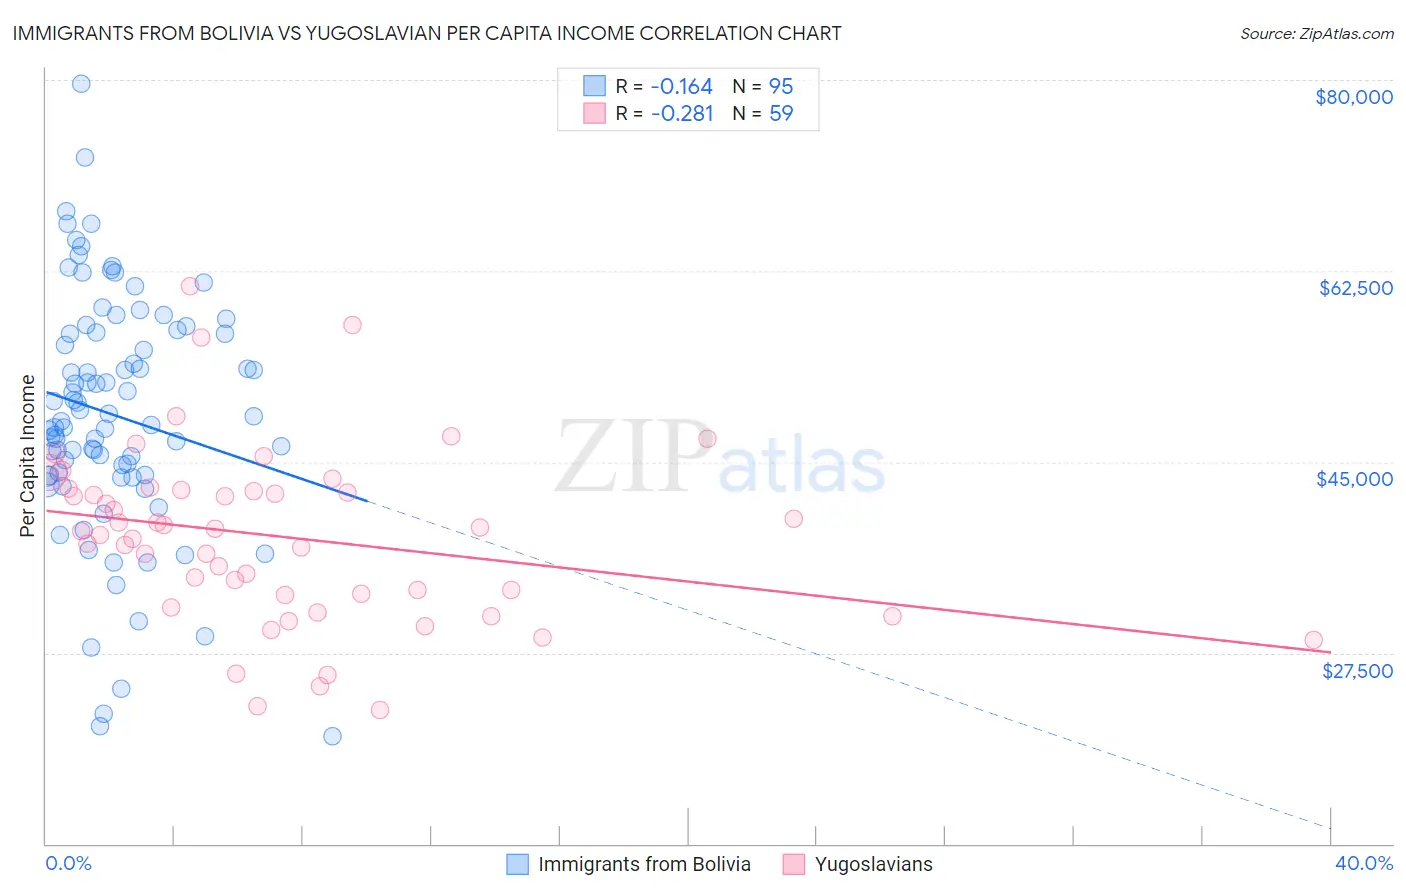
Immigrants from Bolivia vs Yugoslavian Per Capita Income Correlation Chart
The statistical analysis conducted on geographies consisting of 158,726,155 people shows a poor negative correlation between the proportion of Immigrants from Bolivia and per capita income in the United States with a correlation coefficient (R) of -0.164 and weighted average of $48,970. Similarly, the statistical analysis conducted on geographies consisting of 285,729,855 people shows a weak negative correlation between the proportion of Yugoslavians and per capita income in the United States with a correlation coefficient (R) of -0.281 and weighted average of $42,792, a difference of 14.4%.
Per Capita Income Correlation Summary
| Measurement | Immigrants from Bolivia | Yugoslavian |
| Minimum | $19,857 | $22,217 |
| Maximum | $79,655 | $61,060 |
| Range | $59,798 | $38,843 |
| Mean | $49,279 | $38,123 |
| Median | $48,688 | $38,605 |
| Interquartile 25% (IQ1) | $43,768 | $32,828 |
| Interquartile 75% (IQ3) | $56,811 | $42,402 |
| Interquartile Range (IQR) | $13,042 | $9,574 |
| Standard Deviation (Sample) | $11,114 | $8,004 |
| Standard Deviation (Population) | $11,056 | $7,935 |
Similar Demographics by Per Capita Income
Demographics Similar to Immigrants from Bolivia by Per Capita Income
In terms of per capita income, the demographic groups most similar to Immigrants from Bolivia are Immigrants from England ($48,844, a difference of 0.26%), Mongolian ($49,173, a difference of 0.41%), Immigrants from Kazakhstan ($48,747, a difference of 0.46%), Immigrants from Italy ($48,654, a difference of 0.65%), and Immigrants from Hungary ($49,303, a difference of 0.68%).
| Demographics | Rating | Rank | Per Capita Income |
| Lithuanians | 99.8 /100 | #68 | Exceptional $49,448 |
| Immigrants | Canada | 99.8 /100 | #69 | Exceptional $49,412 |
| Immigrants | Eastern Europe | 99.8 /100 | #70 | Exceptional $49,316 |
| Greeks | 99.8 /100 | #71 | Exceptional $49,309 |
| Immigrants | Hungary | 99.8 /100 | #72 | Exceptional $49,303 |
| Immigrants | North America | 99.8 /100 | #73 | Exceptional $49,302 |
| Mongolians | 99.8 /100 | #74 | Exceptional $49,173 |
| Immigrants | Bolivia | 99.7 /100 | #75 | Exceptional $48,970 |
| Immigrants | England | 99.7 /100 | #76 | Exceptional $48,844 |
| Immigrants | Kazakhstan | 99.7 /100 | #77 | Exceptional $48,747 |
| Immigrants | Italy | 99.6 /100 | #78 | Exceptional $48,654 |
| Romanians | 99.5 /100 | #79 | Exceptional $48,445 |
| Egyptians | 99.5 /100 | #80 | Exceptional $48,358 |
| Armenians | 99.4 /100 | #81 | Exceptional $48,287 |
| Immigrants | Indonesia | 99.4 /100 | #82 | Exceptional $48,195 |
Demographics Similar to Yugoslavians by Per Capita Income
In terms of per capita income, the demographic groups most similar to Yugoslavians are Kenyan ($42,808, a difference of 0.040%), Iraqi ($42,760, a difference of 0.070%), Immigrants from Sierra Leone ($42,752, a difference of 0.090%), Immigrants from Fiji ($42,694, a difference of 0.23%), and Bermudan ($42,911, a difference of 0.28%).
| Demographics | Rating | Rank | Per Capita Income |
| Spaniards | 32.9 /100 | #184 | Fair $43,028 |
| Immigrants | Immigrants | 32.5 /100 | #185 | Fair $43,010 |
| French Canadians | 32.3 /100 | #186 | Fair $43,003 |
| Immigrants | Colombia | 31.5 /100 | #187 | Fair $42,971 |
| Immigrants | Africa | 31.0 /100 | #188 | Fair $42,950 |
| Bermudans | 30.1 /100 | #189 | Fair $42,911 |
| Kenyans | 27.7 /100 | #190 | Fair $42,808 |
| Yugoslavians | 27.4 /100 | #191 | Fair $42,792 |
| Iraqis | 26.7 /100 | #192 | Fair $42,760 |
| Immigrants | Sierra Leone | 26.5 /100 | #193 | Fair $42,752 |
| Immigrants | Fiji | 25.2 /100 | #194 | Fair $42,694 |
| Immigrants | Kenya | 24.5 /100 | #195 | Fair $42,661 |
| Dutch | 23.4 /100 | #196 | Fair $42,605 |
| Scotch-Irish | 22.6 /100 | #197 | Fair $42,563 |
| Immigrants | Portugal | 19.7 /100 | #198 | Poor $42,412 |