Immigrants from Saudi Arabia vs Assyrian/Chaldean/Syriac Median Family Income
COMPARE
Immigrants from Saudi Arabia
Assyrian/Chaldean/Syriac
Median Family Income
Median Family Income Comparison
Immigrants from Saudi Arabia
Assyrians/Chaldeans/Syriacs
$108,544
MEDIAN FAMILY INCOME
95.2/ 100
METRIC RATING
113th/ 347
METRIC RANK
$109,622
MEDIAN FAMILY INCOME
97.2/ 100
METRIC RATING
102nd/ 347
METRIC RANK
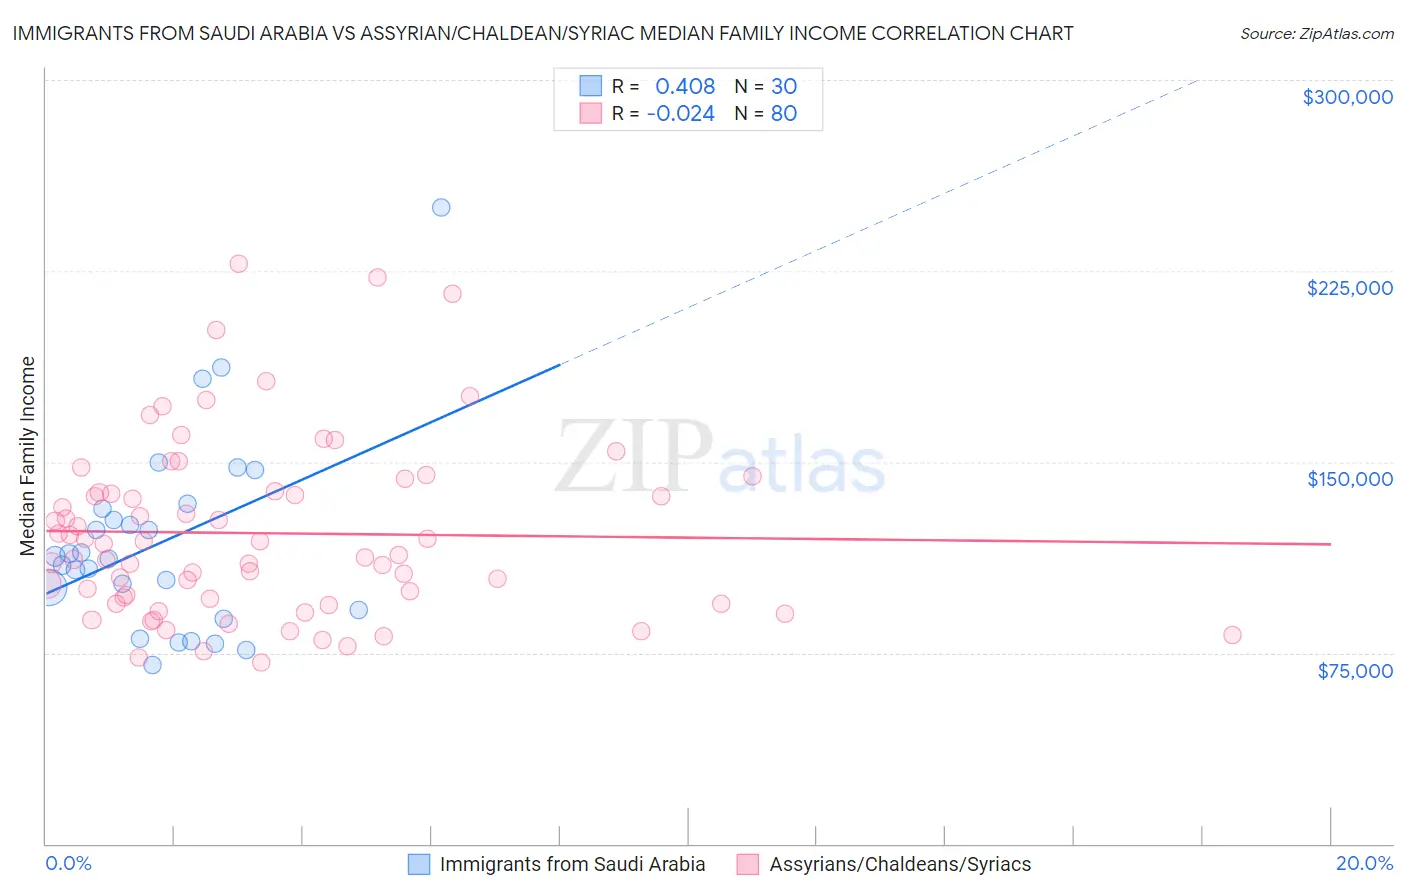
Immigrants from Saudi Arabia vs Assyrian/Chaldean/Syriac Median Family Income Correlation Chart
The statistical analysis conducted on geographies consisting of 164,179,276 people shows a moderate positive correlation between the proportion of Immigrants from Saudi Arabia and median family income in the United States with a correlation coefficient (R) of 0.408 and weighted average of $108,544. Similarly, the statistical analysis conducted on geographies consisting of 110,249,217 people shows no correlation between the proportion of Assyrians/Chaldeans/Syriacs and median family income in the United States with a correlation coefficient (R) of -0.024 and weighted average of $109,622, a difference of 0.99%.
Median Family Income Correlation Summary
| Measurement | Immigrants from Saudi Arabia | Assyrian/Chaldean/Syriac |
| Minimum | $70,185 | $71,012 |
| Maximum | $250,001 | $228,043 |
| Range | $179,816 | $157,031 |
| Mean | $118,570 | $121,955 |
| Median | $112,390 | $115,499 |
| Interquartile 25% (IQ1) | $92,019 | $95,222 |
| Interquartile 75% (IQ3) | $131,535 | $138,288 |
| Interquartile Range (IQR) | $39,516 | $43,065 |
| Standard Deviation (Sample) | $38,218 | $34,820 |
| Standard Deviation (Population) | $37,576 | $34,602 |
Demographics Similar to Immigrants from Saudi Arabia and Assyrians/Chaldeans/Syriacs by Median Family Income
In terms of median family income, the demographic groups most similar to Immigrants from Saudi Arabia are Immigrants from Poland ($108,570, a difference of 0.020%), Polish ($108,507, a difference of 0.030%), Swedish ($108,499, a difference of 0.040%), Chilean ($108,429, a difference of 0.11%), and Immigrants from Western Asia ($108,691, a difference of 0.14%). Similarly, the demographic groups most similar to Assyrians/Chaldeans/Syriacs are Immigrants from Ukraine ($109,645, a difference of 0.020%), Macedonian ($109,668, a difference of 0.040%), Armenian ($109,692, a difference of 0.060%), Immigrants from Kuwait ($109,731, a difference of 0.10%), and Immigrants from Brazil ($109,418, a difference of 0.19%).
| Demographics | Rating | Rank | Median Family Income |
| Jordanians | 97.5 /100 | #97 | Exceptional $109,865 |
| Immigrants | Kuwait | 97.4 /100 | #98 | Exceptional $109,731 |
| Armenians | 97.3 /100 | #99 | Exceptional $109,692 |
| Macedonians | 97.3 /100 | #100 | Exceptional $109,668 |
| Immigrants | Ukraine | 97.2 /100 | #101 | Exceptional $109,645 |
| Assyrians/Chaldeans/Syriacs | 97.2 /100 | #102 | Exceptional $109,622 |
| Immigrants | Brazil | 96.9 /100 | #103 | Exceptional $109,418 |
| Palestinians | 96.9 /100 | #104 | Exceptional $109,413 |
| Syrians | 96.7 /100 | #105 | Exceptional $109,299 |
| Albanians | 96.4 /100 | #106 | Exceptional $109,136 |
| Immigrants | North Macedonia | 96.4 /100 | #107 | Exceptional $109,136 |
| Immigrants | Zimbabwe | 95.9 /100 | #108 | Exceptional $108,830 |
| Immigrants | Afghanistan | 95.6 /100 | #109 | Exceptional $108,709 |
| British | 95.6 /100 | #110 | Exceptional $108,705 |
| Immigrants | Western Asia | 95.6 /100 | #111 | Exceptional $108,691 |
| Immigrants | Poland | 95.3 /100 | #112 | Exceptional $108,570 |
| Immigrants | Saudi Arabia | 95.2 /100 | #113 | Exceptional $108,544 |
| Poles | 95.2 /100 | #114 | Exceptional $108,507 |
| Swedes | 95.1 /100 | #115 | Exceptional $108,499 |
| Chileans | 95.0 /100 | #116 | Exceptional $108,429 |
| Immigrants | Philippines | 94.6 /100 | #117 | Exceptional $108,288 |