Immigrants from Ethiopia vs Assyrian/Chaldean/Syriac Median Family Income
COMPARE
Immigrants from Ethiopia
Assyrian/Chaldean/Syriac
Median Family Income
Median Family Income Comparison
Immigrants from Ethiopia
Assyrians/Chaldeans/Syriacs
$106,969
MEDIAN FAMILY INCOME
90.0/ 100
METRIC RATING
128th/ 347
METRIC RANK
$109,622
MEDIAN FAMILY INCOME
97.2/ 100
METRIC RATING
102nd/ 347
METRIC RANK
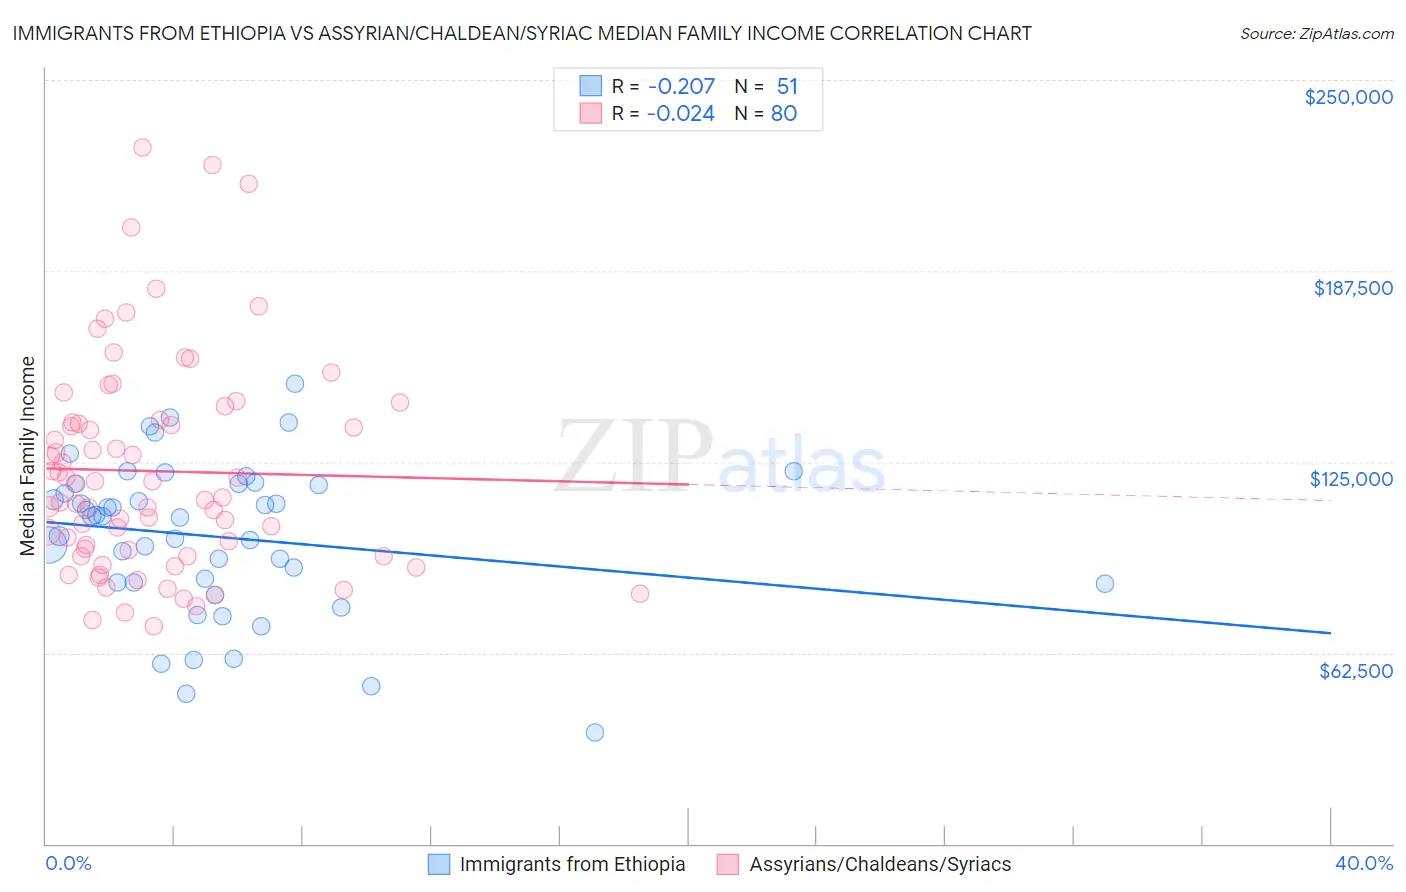
Immigrants from Ethiopia vs Assyrian/Chaldean/Syriac Median Family Income Correlation Chart
The statistical analysis conducted on geographies consisting of 211,422,914 people shows a weak negative correlation between the proportion of Immigrants from Ethiopia and median family income in the United States with a correlation coefficient (R) of -0.207 and weighted average of $106,969. Similarly, the statistical analysis conducted on geographies consisting of 110,249,217 people shows no correlation between the proportion of Assyrians/Chaldeans/Syriacs and median family income in the United States with a correlation coefficient (R) of -0.024 and weighted average of $109,622, a difference of 2.5%.
Median Family Income Correlation Summary
| Measurement | Immigrants from Ethiopia | Assyrian/Chaldean/Syriac |
| Minimum | $36,544 | $71,012 |
| Maximum | $150,528 | $228,043 |
| Range | $113,984 | $157,031 |
| Mean | $100,429 | $121,955 |
| Median | $107,133 | $115,499 |
| Interquartile 25% (IQ1) | $85,358 | $95,222 |
| Interquartile 75% (IQ3) | $117,899 | $138,288 |
| Interquartile Range (IQR) | $32,541 | $43,065 |
| Standard Deviation (Sample) | $24,958 | $34,820 |
| Standard Deviation (Population) | $24,712 | $34,602 |
Similar Demographics by Median Family Income
Demographics Similar to Immigrants from Ethiopia by Median Family Income
In terms of median family income, the demographic groups most similar to Immigrants from Ethiopia are Arab ($106,952, a difference of 0.020%), Brazilian ($106,942, a difference of 0.030%), Lebanese ($107,086, a difference of 0.11%), Serbian ($107,157, a difference of 0.18%), and Taiwanese ($107,295, a difference of 0.30%).
| Demographics | Rating | Rank | Median Family Income |
| Europeans | 94.1 /100 | #121 | Exceptional $108,099 |
| Immigrants | Jordan | 92.9 /100 | #122 | Exceptional $107,715 |
| Carpatho Rusyns | 92.2 /100 | #123 | Exceptional $107,502 |
| Pakistanis | 91.7 /100 | #124 | Exceptional $107,390 |
| Taiwanese | 91.4 /100 | #125 | Exceptional $107,295 |
| Serbians | 90.8 /100 | #126 | Exceptional $107,157 |
| Lebanese | 90.5 /100 | #127 | Exceptional $107,086 |
| Immigrants | Ethiopia | 90.0 /100 | #128 | Excellent $106,969 |
| Arabs | 89.9 /100 | #129 | Excellent $106,952 |
| Brazilians | 89.8 /100 | #130 | Excellent $106,942 |
| Canadians | 88.1 /100 | #131 | Excellent $106,597 |
| Immigrants | Fiji | 87.8 /100 | #132 | Excellent $106,544 |
| Ugandans | 87.8 /100 | #133 | Excellent $106,541 |
| Immigrants | Oceania | 87.3 /100 | #134 | Excellent $106,453 |
| Portuguese | 86.3 /100 | #135 | Excellent $106,286 |
Demographics Similar to Assyrians/Chaldeans/Syriacs by Median Family Income
In terms of median family income, the demographic groups most similar to Assyrians/Chaldeans/Syriacs are Immigrants from Ukraine ($109,645, a difference of 0.020%), Macedonian ($109,668, a difference of 0.040%), Armenian ($109,692, a difference of 0.060%), Immigrants from Kuwait ($109,731, a difference of 0.10%), and Immigrants from Brazil ($109,418, a difference of 0.19%).
| Demographics | Rating | Rank | Median Family Income |
| Zimbabweans | 97.7 /100 | #95 | Exceptional $110,011 |
| Immigrants | Moldova | 97.7 /100 | #96 | Exceptional $109,975 |
| Jordanians | 97.5 /100 | #97 | Exceptional $109,865 |
| Immigrants | Kuwait | 97.4 /100 | #98 | Exceptional $109,731 |
| Armenians | 97.3 /100 | #99 | Exceptional $109,692 |
| Macedonians | 97.3 /100 | #100 | Exceptional $109,668 |
| Immigrants | Ukraine | 97.2 /100 | #101 | Exceptional $109,645 |
| Assyrians/Chaldeans/Syriacs | 97.2 /100 | #102 | Exceptional $109,622 |
| Immigrants | Brazil | 96.9 /100 | #103 | Exceptional $109,418 |
| Palestinians | 96.9 /100 | #104 | Exceptional $109,413 |
| Syrians | 96.7 /100 | #105 | Exceptional $109,299 |
| Albanians | 96.4 /100 | #106 | Exceptional $109,136 |
| Immigrants | North Macedonia | 96.4 /100 | #107 | Exceptional $109,136 |
| Immigrants | Zimbabwe | 95.9 /100 | #108 | Exceptional $108,830 |
| Immigrants | Afghanistan | 95.6 /100 | #109 | Exceptional $108,709 |