Immigrants from Belarus vs Australian Median Household Income
COMPARE
Immigrants from Belarus
Australian
Median Household Income
Median Household Income Comparison
Immigrants from Belarus
Australians
$94,399
MEDIAN HOUSEHOLD INCOME
99.7/ 100
METRIC RATING
65th/ 347
METRIC RANK
$96,490
MEDIAN HOUSEHOLD INCOME
99.9/ 100
METRIC RATING
46th/ 347
METRIC RANK
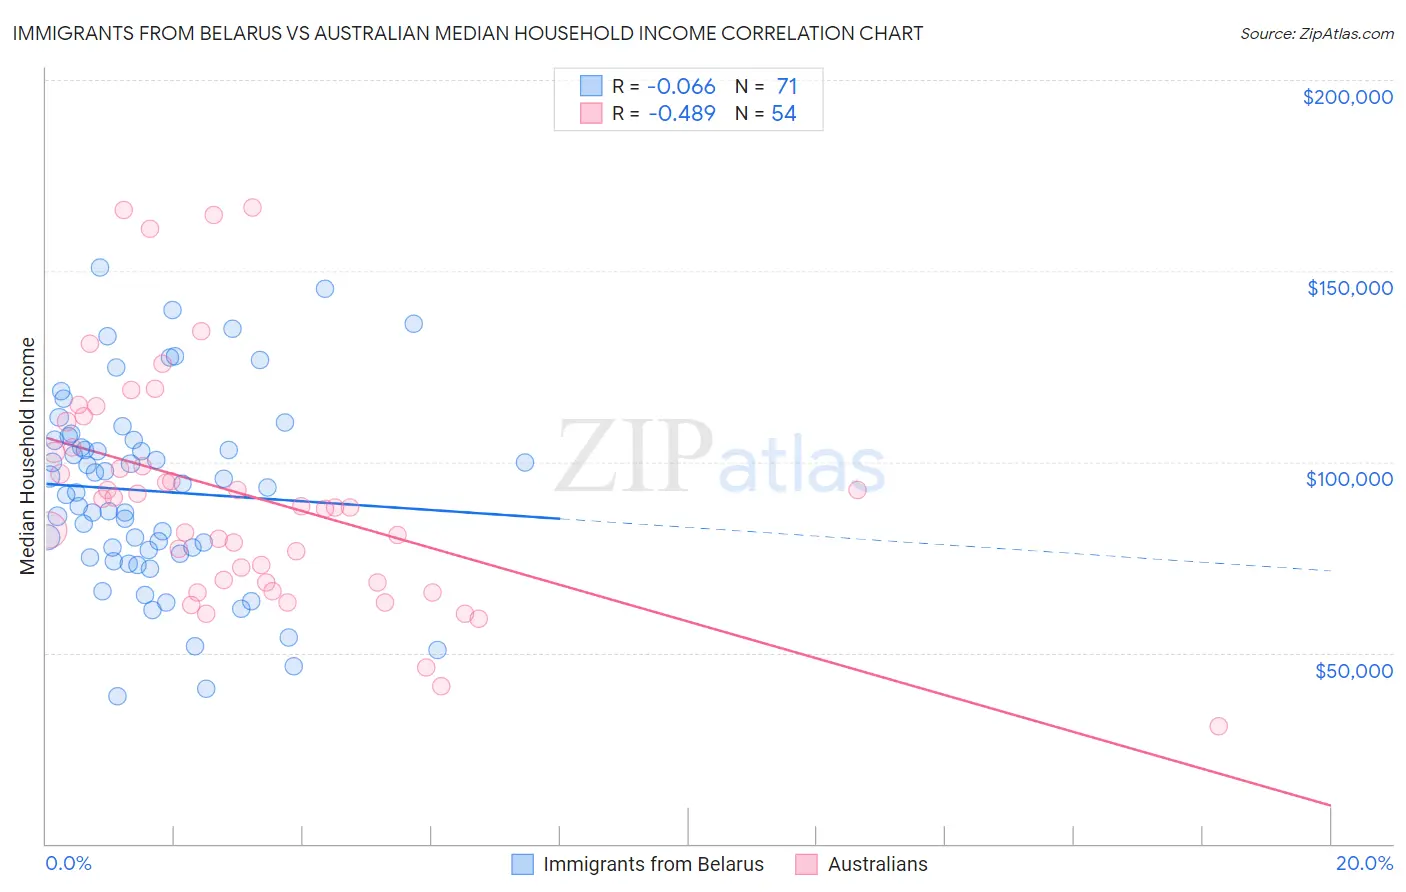
Immigrants from Belarus vs Australian Median Household Income Correlation Chart
The statistical analysis conducted on geographies consisting of 150,184,095 people shows a slight negative correlation between the proportion of Immigrants from Belarus and median household income in the United States with a correlation coefficient (R) of -0.066 and weighted average of $94,399. Similarly, the statistical analysis conducted on geographies consisting of 223,978,576 people shows a moderate negative correlation between the proportion of Australians and median household income in the United States with a correlation coefficient (R) of -0.489 and weighted average of $96,490, a difference of 2.2%.
Median Household Income Correlation Summary
| Measurement | Immigrants from Belarus | Australian |
| Minimum | $38,670 | $30,714 |
| Maximum | $150,801 | $166,528 |
| Range | $112,131 | $135,814 |
| Mean | $92,306 | $91,180 |
| Median | $93,264 | $88,142 |
| Interquartile 25% (IQ1) | $75,784 | $68,506 |
| Interquartile 75% (IQ3) | $105,707 | $103,837 |
| Interquartile Range (IQR) | $29,923 | $35,331 |
| Standard Deviation (Sample) | $25,053 | $30,330 |
| Standard Deviation (Population) | $24,876 | $30,047 |
Demographics Similar to Immigrants from Belarus and Australians by Median Household Income
In terms of median household income, the demographic groups most similar to Immigrants from Belarus are Immigrants from Netherlands ($94,411, a difference of 0.010%), Greek ($94,735, a difference of 0.36%), Immigrants from Norway ($94,846, a difference of 0.47%), Laotian ($94,990, a difference of 0.63%), and Korean ($95,018, a difference of 0.65%). Similarly, the demographic groups most similar to Australians are Israeli ($96,552, a difference of 0.060%), Immigrants from Russia ($96,378, a difference of 0.12%), Cambodian ($96,324, a difference of 0.17%), Immigrants from Malaysia ($96,292, a difference of 0.21%), and Bulgarian ($96,290, a difference of 0.21%).
| Demographics | Rating | Rank | Median Household Income |
| Israelis | 99.9 /100 | #45 | Exceptional $96,552 |
| Australians | 99.9 /100 | #46 | Exceptional $96,490 |
| Immigrants | Russia | 99.9 /100 | #47 | Exceptional $96,378 |
| Cambodians | 99.9 /100 | #48 | Exceptional $96,324 |
| Immigrants | Malaysia | 99.9 /100 | #49 | Exceptional $96,292 |
| Bulgarians | 99.9 /100 | #50 | Exceptional $96,290 |
| Estonians | 99.9 /100 | #51 | Exceptional $95,930 |
| Immigrants | South Africa | 99.9 /100 | #52 | Exceptional $95,800 |
| Paraguayans | 99.9 /100 | #53 | Exceptional $95,737 |
| Egyptians | 99.9 /100 | #54 | Exceptional $95,673 |
| Immigrants | Czechoslovakia | 99.9 /100 | #55 | Exceptional $95,319 |
| Immigrants | Austria | 99.9 /100 | #56 | Exceptional $95,277 |
| New Zealanders | 99.8 /100 | #57 | Exceptional $95,146 |
| Soviet Union | 99.8 /100 | #58 | Exceptional $95,098 |
| Immigrants | Europe | 99.8 /100 | #59 | Exceptional $95,032 |
| Koreans | 99.8 /100 | #60 | Exceptional $95,018 |
| Laotians | 99.8 /100 | #61 | Exceptional $94,990 |
| Immigrants | Norway | 99.8 /100 | #62 | Exceptional $94,846 |
| Greeks | 99.8 /100 | #63 | Exceptional $94,735 |
| Immigrants | Netherlands | 99.7 /100 | #64 | Exceptional $94,411 |
| Immigrants | Belarus | 99.7 /100 | #65 | Exceptional $94,399 |