Immigrants from Barbados vs Finnish Nursery School
COMPARE
Immigrants from Barbados
Finnish
Nursery School
Nursery School Comparison
Immigrants from Barbados
Finns
97.4%
NURSERY SCHOOL
0.0/ 100
METRIC RATING
285th/ 347
METRIC RANK
98.6%
NURSERY SCHOOL
100.0/ 100
METRIC RATING
21st/ 347
METRIC RANK
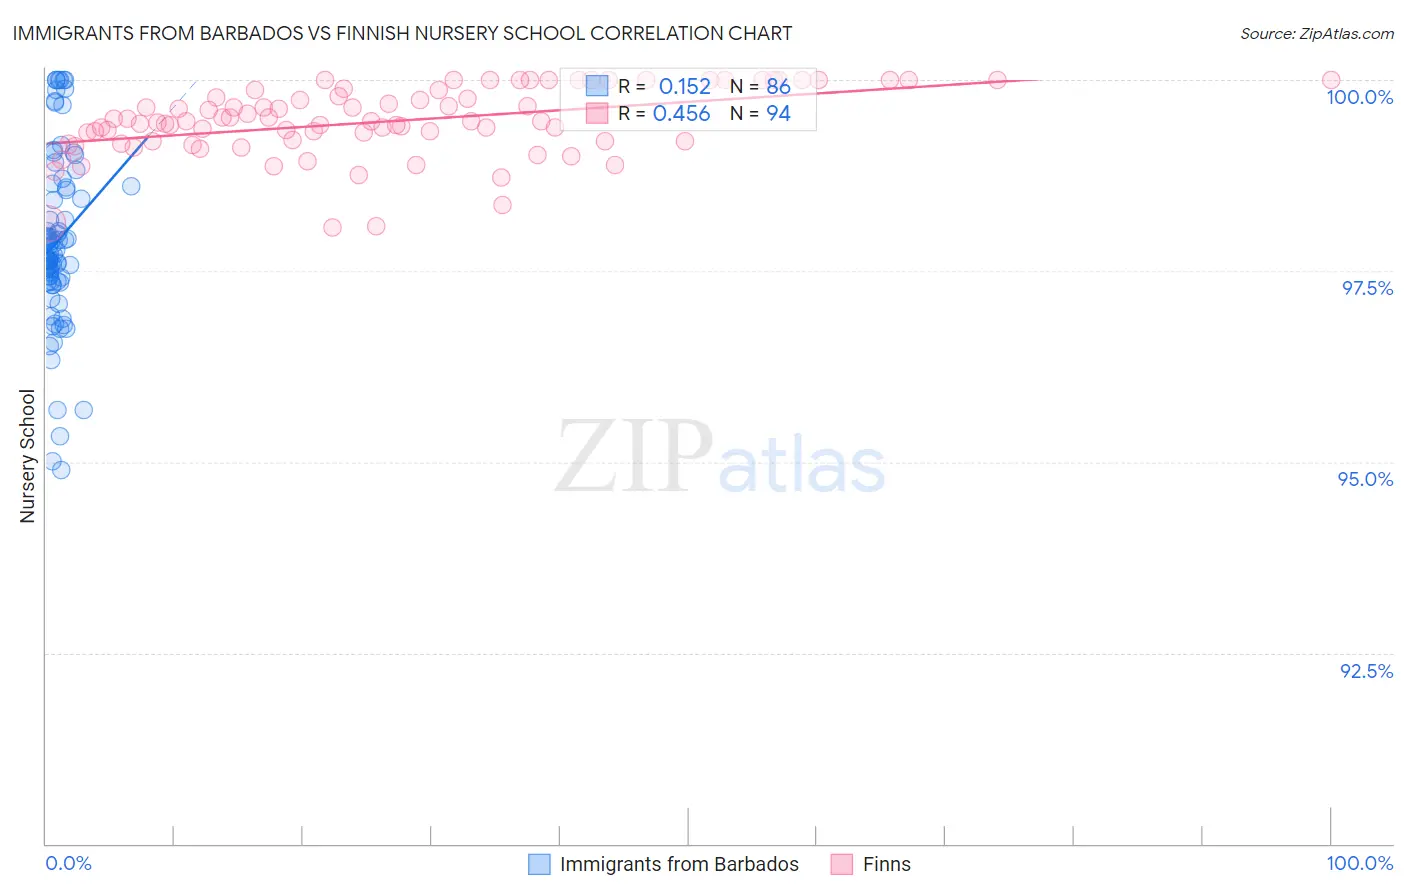
Immigrants from Barbados vs Finnish Nursery School Correlation Chart
The statistical analysis conducted on geographies consisting of 112,787,503 people shows a poor positive correlation between the proportion of Immigrants from Barbados and percentage of population with at least nursery school education in the United States with a correlation coefficient (R) of 0.152 and weighted average of 97.4%. Similarly, the statistical analysis conducted on geographies consisting of 404,675,516 people shows a moderate positive correlation between the proportion of Finns and percentage of population with at least nursery school education in the United States with a correlation coefficient (R) of 0.456 and weighted average of 98.6%, a difference of 1.3%.
Nursery School Correlation Summary
| Measurement | Immigrants from Barbados | Finnish |
| Minimum | 94.9% | 98.1% |
| Maximum | 100.0% | 100.0% |
| Range | 5.1% | 1.9% |
| Mean | 97.9% | 99.5% |
| Median | 97.7% | 99.5% |
| Interquartile 25% (IQ1) | 97.4% | 99.2% |
| Interquartile 75% (IQ3) | 98.6% | 99.9% |
| Interquartile Range (IQR) | 1.2% | 0.67% |
| Standard Deviation (Sample) | 1.1% | 0.45% |
| Standard Deviation (Population) | 1.1% | 0.45% |
Similar Demographics by Nursery School
Demographics Similar to Immigrants from Barbados by Nursery School
In terms of nursery school, the demographic groups most similar to Immigrants from Barbados are Immigrants from Portugal (97.4%, a difference of 0.0%), Immigrants from Hong Kong (97.4%, a difference of 0.010%), Immigrants from West Indies (97.4%, a difference of 0.020%), Immigrants from Trinidad and Tobago (97.4%, a difference of 0.020%), and Immigrants from Thailand (97.3%, a difference of 0.030%).
| Demographics | Rating | Rank | Nursery School |
| Immigrants | Uzbekistan | 0.1 /100 | #278 | Tragic 97.4% |
| Immigrants | Ghana | 0.1 /100 | #279 | Tragic 97.4% |
| Barbadians | 0.0 /100 | #280 | Tragic 97.4% |
| Trinidadians and Tobagonians | 0.0 /100 | #281 | Tragic 97.4% |
| Afghans | 0.0 /100 | #282 | Tragic 97.4% |
| Immigrants | West Indies | 0.0 /100 | #283 | Tragic 97.4% |
| Immigrants | Trinidad and Tobago | 0.0 /100 | #284 | Tragic 97.4% |
| Immigrants | Barbados | 0.0 /100 | #285 | Tragic 97.4% |
| Immigrants | Portugal | 0.0 /100 | #286 | Tragic 97.4% |
| Immigrants | Hong Kong | 0.0 /100 | #287 | Tragic 97.4% |
| Immigrants | Thailand | 0.0 /100 | #288 | Tragic 97.3% |
| Immigrants | St. Vincent and the Grenadines | 0.0 /100 | #289 | Tragic 97.3% |
| Immigrants | Afghanistan | 0.0 /100 | #290 | Tragic 97.3% |
| British West Indians | 0.0 /100 | #291 | Tragic 97.3% |
| Houma | 0.0 /100 | #292 | Tragic 97.3% |
Demographics Similar to Finns by Nursery School
In terms of nursery school, the demographic groups most similar to Finns are Pennsylvania German (98.6%, a difference of 0.0%), Lithuanian (98.6%, a difference of 0.0%), Polish (98.6%, a difference of 0.0%), Danish (98.6%, a difference of 0.0%), and Scotch-Irish (98.6%, a difference of 0.0%).
| Demographics | Rating | Rank | Nursery School |
| Carpatho Rusyns | 100.0 /100 | #14 | Exceptional 98.7% |
| Swedes | 100.0 /100 | #15 | Exceptional 98.7% |
| Scottish | 100.0 /100 | #16 | Exceptional 98.7% |
| Aleuts | 100.0 /100 | #17 | Exceptional 98.7% |
| Dutch | 100.0 /100 | #18 | Exceptional 98.7% |
| Irish | 100.0 /100 | #19 | Exceptional 98.6% |
| Pennsylvania Germans | 100.0 /100 | #20 | Exceptional 98.6% |
| Finns | 100.0 /100 | #21 | Exceptional 98.6% |
| Lithuanians | 100.0 /100 | #22 | Exceptional 98.6% |
| Poles | 100.0 /100 | #23 | Exceptional 98.6% |
| Danes | 100.0 /100 | #24 | Exceptional 98.6% |
| Scotch-Irish | 100.0 /100 | #25 | Exceptional 98.6% |
| Sioux | 100.0 /100 | #26 | Exceptional 98.6% |
| Arapaho | 100.0 /100 | #27 | Exceptional 98.6% |
| Croatians | 100.0 /100 | #28 | Exceptional 98.6% |