Egyptian vs Finnish Median Female Earnings
COMPARE
Egyptian
Finnish
Median Female Earnings
Median Female Earnings Comparison
Egyptians
Finns
$43,305
MEDIAN FEMALE EARNINGS
99.9/ 100
METRIC RATING
55th/ 347
METRIC RANK
$38,173
MEDIAN FEMALE EARNINGS
4.0/ 100
METRIC RATING
240th/ 347
METRIC RANK
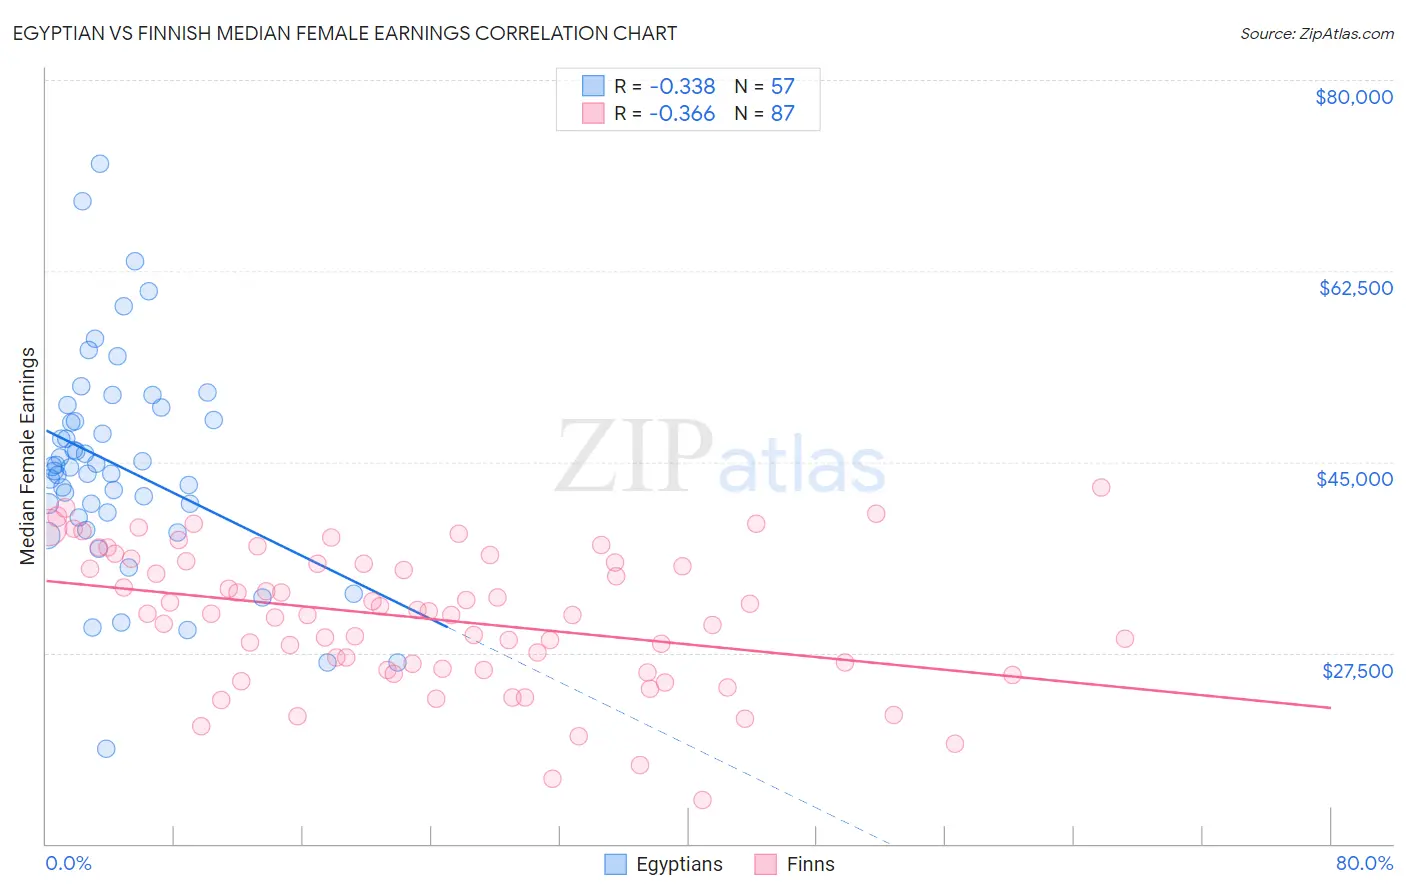
Egyptian vs Finnish Median Female Earnings Correlation Chart
The statistical analysis conducted on geographies consisting of 276,887,423 people shows a mild negative correlation between the proportion of Egyptians and median female earnings in the United States with a correlation coefficient (R) of -0.338 and weighted average of $43,305. Similarly, the statistical analysis conducted on geographies consisting of 404,382,146 people shows a mild negative correlation between the proportion of Finns and median female earnings in the United States with a correlation coefficient (R) of -0.366 and weighted average of $38,173, a difference of 13.5%.
Median Female Earnings Correlation Summary
| Measurement | Egyptian | Finnish |
| Minimum | $18,750 | $14,000 |
| Maximum | $72,362 | $42,614 |
| Range | $53,612 | $28,614 |
| Mean | $44,581 | $30,656 |
| Median | $44,449 | $31,094 |
| Interquartile 25% (IQ1) | $40,134 | $25,915 |
| Interquartile 75% (IQ3) | $49,358 | $35,736 |
| Interquartile Range (IQR) | $9,224 | $9,822 |
| Standard Deviation (Sample) | $9,878 | $6,298 |
| Standard Deviation (Population) | $9,791 | $6,261 |
Similar Demographics by Median Female Earnings
Demographics Similar to Egyptians by Median Female Earnings
In terms of median female earnings, the demographic groups most similar to Egyptians are Immigrants from Eastern Europe ($43,309, a difference of 0.010%), Australian ($43,308, a difference of 0.010%), Immigrants from Lithuania ($43,317, a difference of 0.030%), Immigrants from Croatia ($43,258, a difference of 0.11%), and Maltese ($43,357, a difference of 0.12%).
| Demographics | Rating | Rank | Median Female Earnings |
| Immigrants | Indonesia | 100.0 /100 | #48 | Exceptional $43,412 |
| Immigrants | Serbia | 100.0 /100 | #49 | Exceptional $43,385 |
| Immigrants | Uzbekistan | 100.0 /100 | #50 | Exceptional $43,363 |
| Maltese | 100.0 /100 | #51 | Exceptional $43,357 |
| Immigrants | Lithuania | 99.9 /100 | #52 | Exceptional $43,317 |
| Immigrants | Eastern Europe | 99.9 /100 | #53 | Exceptional $43,309 |
| Australians | 99.9 /100 | #54 | Exceptional $43,308 |
| Egyptians | 99.9 /100 | #55 | Exceptional $43,305 |
| Immigrants | Croatia | 99.9 /100 | #56 | Exceptional $43,258 |
| Ethiopians | 99.9 /100 | #57 | Exceptional $43,243 |
| Paraguayans | 99.9 /100 | #58 | Exceptional $43,173 |
| Estonians | 99.9 /100 | #59 | Exceptional $43,106 |
| Immigrants | Latvia | 99.9 /100 | #60 | Exceptional $43,099 |
| Immigrants | Bulgaria | 99.9 /100 | #61 | Exceptional $43,085 |
| Afghans | 99.9 /100 | #62 | Exceptional $43,077 |
Demographics Similar to Finns by Median Female Earnings
In terms of median female earnings, the demographic groups most similar to Finns are English ($38,196, a difference of 0.060%), Alaska Native ($38,202, a difference of 0.080%), Immigrants from Cabo Verde ($38,208, a difference of 0.090%), Sudanese ($38,215, a difference of 0.11%), and Liberian ($38,215, a difference of 0.11%).
| Demographics | Rating | Rank | Median Female Earnings |
| Tongans | 5.1 /100 | #233 | Tragic $38,288 |
| Celtics | 5.0 /100 | #234 | Tragic $38,283 |
| Sudanese | 4.4 /100 | #235 | Tragic $38,215 |
| Liberians | 4.4 /100 | #236 | Tragic $38,215 |
| Immigrants | Cabo Verde | 4.3 /100 | #237 | Tragic $38,208 |
| Alaska Natives | 4.3 /100 | #238 | Tragic $38,202 |
| English | 4.2 /100 | #239 | Tragic $38,196 |
| Finns | 4.0 /100 | #240 | Tragic $38,173 |
| Spanish | 3.5 /100 | #241 | Tragic $38,098 |
| Immigrants | Burma/Myanmar | 3.0 /100 | #242 | Tragic $38,028 |
| Germans | 2.8 /100 | #243 | Tragic $37,986 |
| Immigrants | Liberia | 2.7 /100 | #244 | Tragic $37,970 |
| Immigrants | Middle Africa | 2.7 /100 | #245 | Tragic $37,965 |
| Delaware | 2.6 /100 | #246 | Tragic $37,964 |
| Immigrants | Somalia | 2.4 /100 | #247 | Tragic $37,914 |