Immigrants from Haiti vs Finnish Median Female Earnings
COMPARE
Immigrants from Haiti
Finnish
Median Female Earnings
Median Female Earnings Comparison
Immigrants from Haiti
Finns
$36,203
MEDIAN FEMALE EARNINGS
0.1/ 100
METRIC RATING
283rd/ 347
METRIC RANK
$38,173
MEDIAN FEMALE EARNINGS
4.0/ 100
METRIC RATING
240th/ 347
METRIC RANK
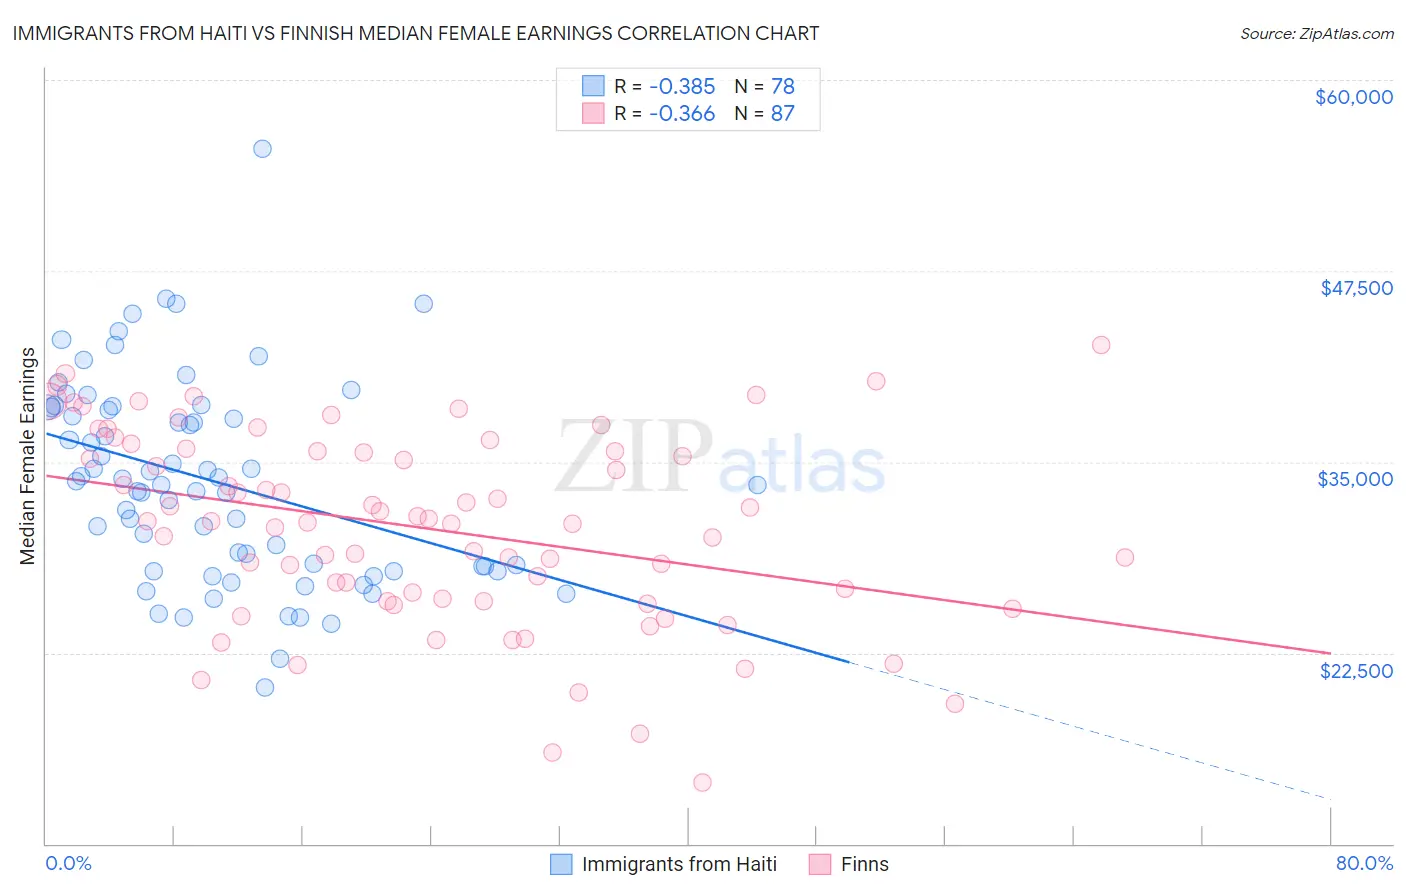
Immigrants from Haiti vs Finnish Median Female Earnings Correlation Chart
The statistical analysis conducted on geographies consisting of 225,248,114 people shows a mild negative correlation between the proportion of Immigrants from Haiti and median female earnings in the United States with a correlation coefficient (R) of -0.385 and weighted average of $36,203. Similarly, the statistical analysis conducted on geographies consisting of 404,382,146 people shows a mild negative correlation between the proportion of Finns and median female earnings in the United States with a correlation coefficient (R) of -0.366 and weighted average of $38,173, a difference of 5.4%.
Median Female Earnings Correlation Summary
| Measurement | Immigrants from Haiti | Finnish |
| Minimum | $20,229 | $14,000 |
| Maximum | $55,536 | $42,614 |
| Range | $35,307 | $28,614 |
| Mean | $33,736 | $30,656 |
| Median | $33,585 | $31,094 |
| Interquartile 25% (IQ1) | $28,139 | $25,915 |
| Interquartile 75% (IQ3) | $38,581 | $35,736 |
| Interquartile Range (IQR) | $10,442 | $9,822 |
| Standard Deviation (Sample) | $6,572 | $6,298 |
| Standard Deviation (Population) | $6,529 | $6,261 |
Similar Demographics by Median Female Earnings
Demographics Similar to Immigrants from Haiti by Median Female Earnings
In terms of median female earnings, the demographic groups most similar to Immigrants from Haiti are Indonesian ($36,140, a difference of 0.17%), Paiute ($36,056, a difference of 0.41%), Haitian ($36,374, a difference of 0.47%), Osage ($36,034, a difference of 0.47%), and Immigrants from Nicaragua ($36,023, a difference of 0.50%).
| Demographics | Rating | Rank | Median Female Earnings |
| Central Americans | 0.1 /100 | #276 | Tragic $36,492 |
| Marshallese | 0.1 /100 | #277 | Tragic $36,459 |
| U.S. Virgin Islanders | 0.1 /100 | #278 | Tragic $36,424 |
| Immigrants | Caribbean | 0.1 /100 | #279 | Tragic $36,414 |
| Iroquois | 0.1 /100 | #280 | Tragic $36,408 |
| Spanish Americans | 0.1 /100 | #281 | Tragic $36,391 |
| Haitians | 0.1 /100 | #282 | Tragic $36,374 |
| Immigrants | Haiti | 0.1 /100 | #283 | Tragic $36,203 |
| Indonesians | 0.1 /100 | #284 | Tragic $36,140 |
| Paiute | 0.1 /100 | #285 | Tragic $36,056 |
| Osage | 0.0 /100 | #286 | Tragic $36,034 |
| Immigrants | Nicaragua | 0.0 /100 | #287 | Tragic $36,023 |
| Immigrants | Zaire | 0.0 /100 | #288 | Tragic $36,017 |
| Bangladeshis | 0.0 /100 | #289 | Tragic $35,960 |
| Central American Indians | 0.0 /100 | #290 | Tragic $35,930 |
Demographics Similar to Finns by Median Female Earnings
In terms of median female earnings, the demographic groups most similar to Finns are English ($38,196, a difference of 0.060%), Alaska Native ($38,202, a difference of 0.080%), Immigrants from Cabo Verde ($38,208, a difference of 0.090%), Sudanese ($38,215, a difference of 0.11%), and Liberian ($38,215, a difference of 0.11%).
| Demographics | Rating | Rank | Median Female Earnings |
| Tongans | 5.1 /100 | #233 | Tragic $38,288 |
| Celtics | 5.0 /100 | #234 | Tragic $38,283 |
| Sudanese | 4.4 /100 | #235 | Tragic $38,215 |
| Liberians | 4.4 /100 | #236 | Tragic $38,215 |
| Immigrants | Cabo Verde | 4.3 /100 | #237 | Tragic $38,208 |
| Alaska Natives | 4.3 /100 | #238 | Tragic $38,202 |
| English | 4.2 /100 | #239 | Tragic $38,196 |
| Finns | 4.0 /100 | #240 | Tragic $38,173 |
| Spanish | 3.5 /100 | #241 | Tragic $38,098 |
| Immigrants | Burma/Myanmar | 3.0 /100 | #242 | Tragic $38,028 |
| Germans | 2.8 /100 | #243 | Tragic $37,986 |
| Immigrants | Liberia | 2.7 /100 | #244 | Tragic $37,970 |
| Immigrants | Middle Africa | 2.7 /100 | #245 | Tragic $37,965 |
| Delaware | 2.6 /100 | #246 | Tragic $37,964 |
| Immigrants | Somalia | 2.4 /100 | #247 | Tragic $37,914 |