Immigrants from Bangladesh vs Romanian Professional Degree
COMPARE
Immigrants from Bangladesh
Romanian
Professional Degree
Professional Degree Comparison
Immigrants from Bangladesh
Romanians
4.4%
PROFESSIONAL DEGREE
56.0/ 100
METRIC RATING
171st/ 347
METRIC RANK
5.3%
PROFESSIONAL DEGREE
99.6/ 100
METRIC RATING
82nd/ 347
METRIC RANK
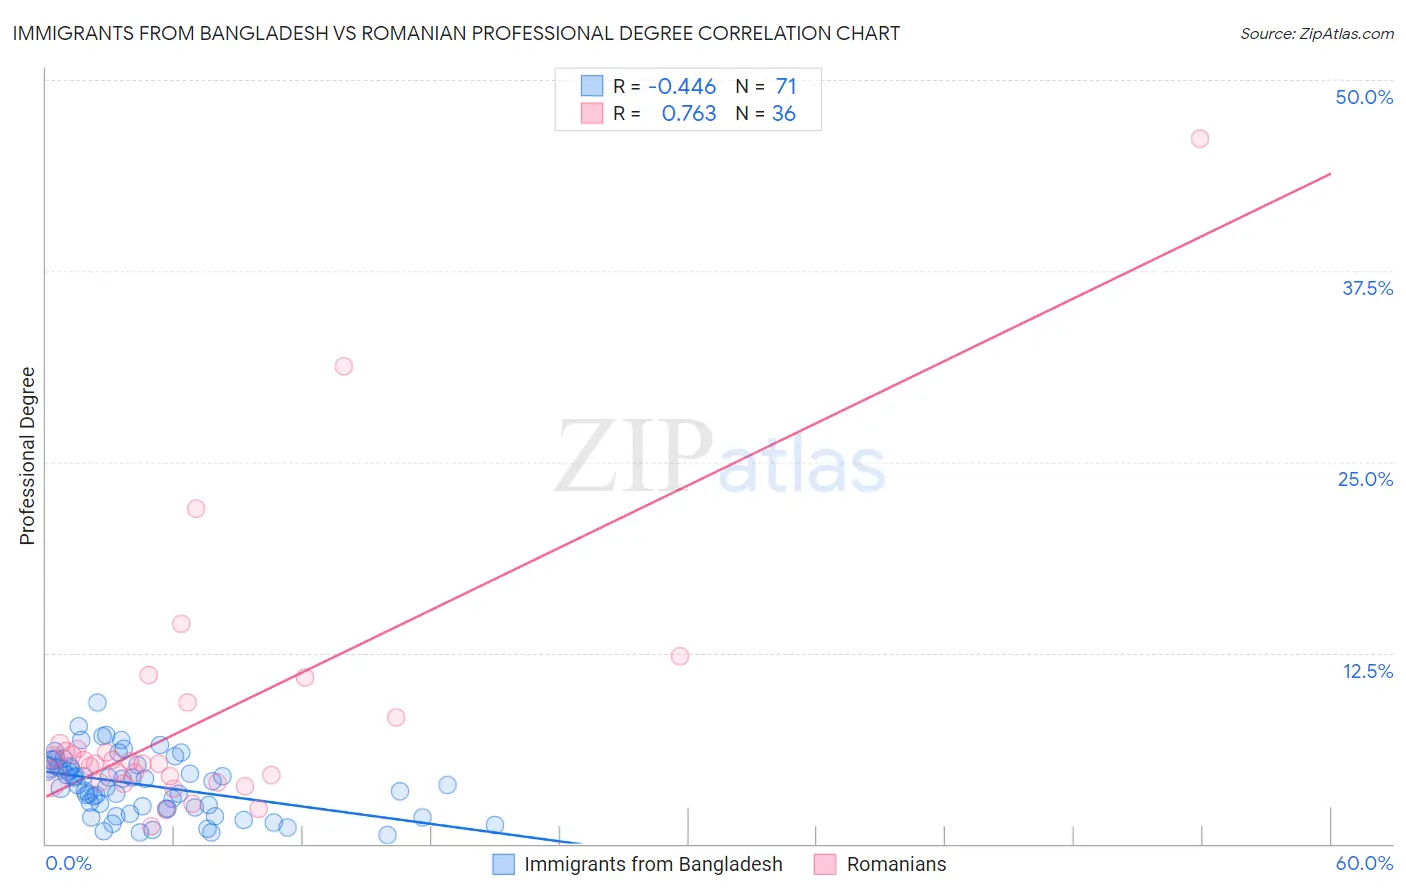
Immigrants from Bangladesh vs Romanian Professional Degree Correlation Chart
The statistical analysis conducted on geographies consisting of 203,559,674 people shows a moderate negative correlation between the proportion of Immigrants from Bangladesh and percentage of population with at least professional degree education in the United States with a correlation coefficient (R) of -0.446 and weighted average of 4.4%. Similarly, the statistical analysis conducted on geographies consisting of 377,177,462 people shows a strong positive correlation between the proportion of Romanians and percentage of population with at least professional degree education in the United States with a correlation coefficient (R) of 0.763 and weighted average of 5.3%, a difference of 18.9%.
Professional Degree Correlation Summary
| Measurement | Immigrants from Bangladesh | Romanian |
| Minimum | 0.56% | 1.1% |
| Maximum | 9.3% | 46.2% |
| Range | 8.7% | 45.0% |
| Mean | 3.8% | 8.0% |
| Median | 3.9% | 5.3% |
| Interquartile 25% (IQ1) | 2.3% | 4.2% |
| Interquartile 75% (IQ3) | 5.1% | 7.4% |
| Interquartile Range (IQR) | 2.8% | 3.2% |
| Standard Deviation (Sample) | 1.9% | 8.7% |
| Standard Deviation (Population) | 1.9% | 8.5% |
Similar Demographics by Professional Degree
Demographics Similar to Immigrants from Bangladesh by Professional Degree
In terms of professional degree, the demographic groups most similar to Immigrants from Bangladesh are Immigrants from Zaire (4.5%, a difference of 0.22%), Chinese (4.5%, a difference of 0.39%), Immigrants from Sierra Leone (4.5%, a difference of 0.41%), Immigrants from Afghanistan (4.5%, a difference of 0.48%), and Immigrants from Colombia (4.5%, a difference of 0.51%).
| Demographics | Rating | Rank | Professional Degree |
| Swiss | 61.0 /100 | #164 | Good 4.5% |
| Costa Ricans | 59.9 /100 | #165 | Average 4.5% |
| Immigrants | Colombia | 59.4 /100 | #166 | Average 4.5% |
| Immigrants | Afghanistan | 59.2 /100 | #167 | Average 4.5% |
| Immigrants | Sierra Leone | 58.7 /100 | #168 | Average 4.5% |
| Chinese | 58.6 /100 | #169 | Average 4.5% |
| Immigrants | Zaire | 57.4 /100 | #170 | Average 4.5% |
| Immigrants | Bangladesh | 56.0 /100 | #171 | Average 4.4% |
| Spaniards | 52.0 /100 | #172 | Average 4.4% |
| English | 50.1 /100 | #173 | Average 4.4% |
| Kenyans | 50.0 /100 | #174 | Average 4.4% |
| Irish | 50.0 /100 | #175 | Average 4.4% |
| Immigrants | Peru | 49.3 /100 | #176 | Average 4.4% |
| Celtics | 47.6 /100 | #177 | Average 4.4% |
| Immigrants | Costa Rica | 46.7 /100 | #178 | Average 4.4% |
Demographics Similar to Romanians by Professional Degree
In terms of professional degree, the demographic groups most similar to Romanians are Carpatho Rusyn (5.3%, a difference of 0.20%), Immigrants from Croatia (5.3%, a difference of 0.20%), Immigrants from Zimbabwe (5.3%, a difference of 0.22%), Greek (5.3%, a difference of 0.23%), and Immigrants from Chile (5.3%, a difference of 0.33%).
| Demographics | Rating | Rank | Professional Degree |
| Immigrants | Indonesia | 99.7 /100 | #75 | Exceptional 5.3% |
| Immigrants | Canada | 99.7 /100 | #76 | Exceptional 5.3% |
| Immigrants | Ethiopia | 99.7 /100 | #77 | Exceptional 5.3% |
| Armenians | 99.7 /100 | #78 | Exceptional 5.3% |
| Immigrants | North America | 99.7 /100 | #79 | Exceptional 5.3% |
| Immigrants | England | 99.6 /100 | #80 | Exceptional 5.3% |
| Immigrants | Brazil | 99.6 /100 | #81 | Exceptional 5.3% |
| Romanians | 99.6 /100 | #82 | Exceptional 5.3% |
| Carpatho Rusyns | 99.6 /100 | #83 | Exceptional 5.3% |
| Immigrants | Croatia | 99.6 /100 | #84 | Exceptional 5.3% |
| Immigrants | Zimbabwe | 99.6 /100 | #85 | Exceptional 5.3% |
| Greeks | 99.6 /100 | #86 | Exceptional 5.3% |
| Immigrants | Chile | 99.5 /100 | #87 | Exceptional 5.3% |
| Egyptians | 99.5 /100 | #88 | Exceptional 5.3% |
| Chileans | 99.5 /100 | #89 | Exceptional 5.3% |