Immigrants from Bangladesh vs Romanian Male Disability
COMPARE
Immigrants from Bangladesh
Romanian
Male Disability
Male Disability Comparison
Immigrants from Bangladesh
Romanians
10.3%
MALE DISABILITY
99.7/ 100
METRIC RATING
43rd/ 347
METRIC RANK
11.2%
MALE DISABILITY
50.7/ 100
METRIC RATING
172nd/ 347
METRIC RANK
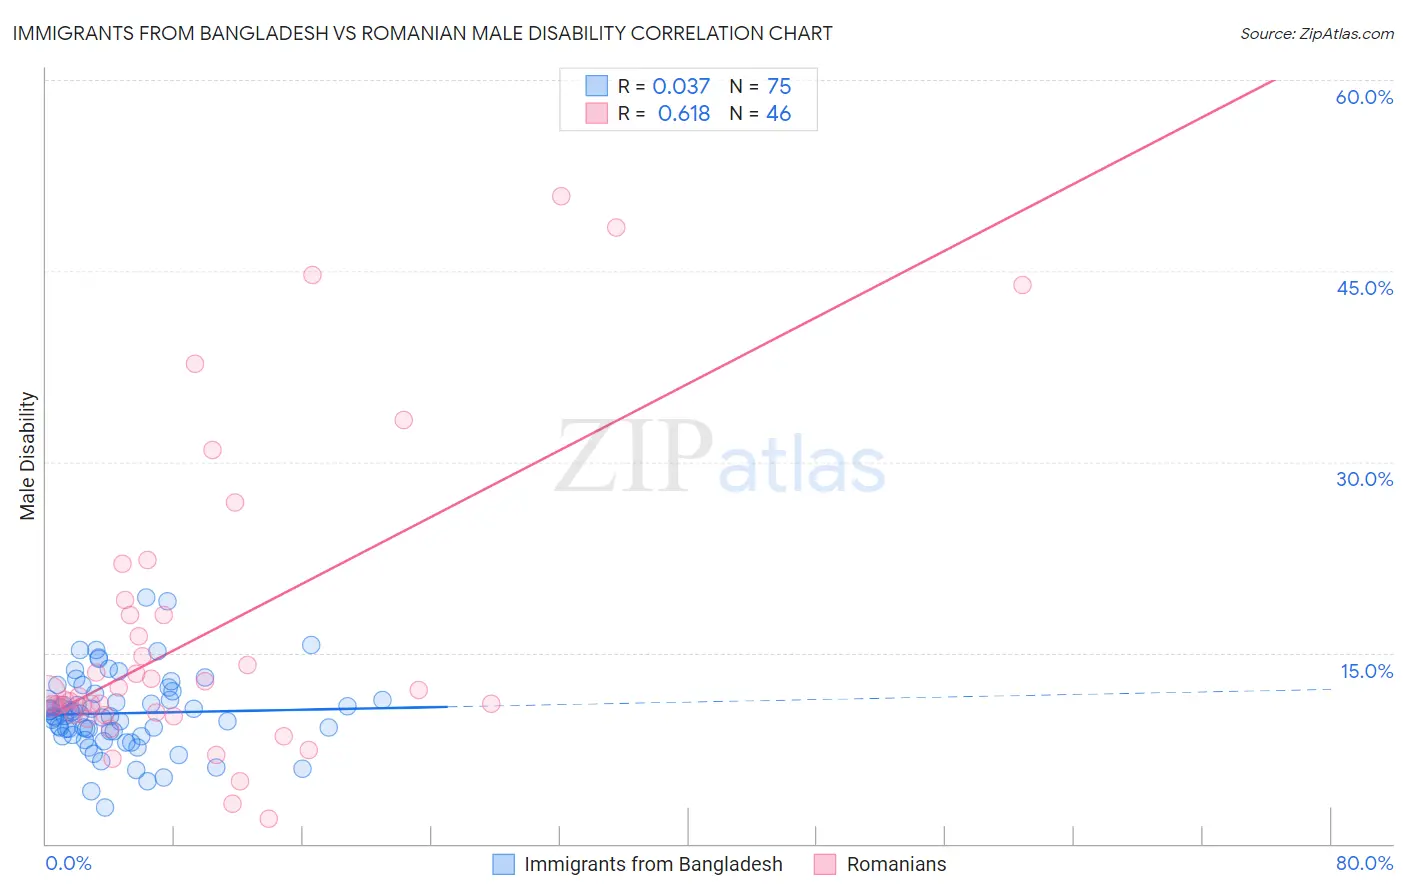
Immigrants from Bangladesh vs Romanian Male Disability Correlation Chart
The statistical analysis conducted on geographies consisting of 203,673,842 people shows no correlation between the proportion of Immigrants from Bangladesh and percentage of males with a disability in the United States with a correlation coefficient (R) of 0.037 and weighted average of 10.3%. Similarly, the statistical analysis conducted on geographies consisting of 377,848,419 people shows a significant positive correlation between the proportion of Romanians and percentage of males with a disability in the United States with a correlation coefficient (R) of 0.618 and weighted average of 11.2%, a difference of 8.9%.
Male Disability Correlation Summary
| Measurement | Immigrants from Bangladesh | Romanian |
| Minimum | 2.9% | 2.0% |
| Maximum | 19.4% | 50.8% |
| Range | 16.5% | 48.8% |
| Mean | 10.3% | 16.5% |
| Median | 10.1% | 11.7% |
| Interquartile 25% (IQ1) | 8.6% | 10.2% |
| Interquartile 75% (IQ3) | 11.8% | 18.0% |
| Interquartile Range (IQR) | 3.2% | 7.8% |
| Standard Deviation (Sample) | 3.0% | 11.9% |
| Standard Deviation (Population) | 3.0% | 11.8% |
Similar Demographics by Male Disability
Demographics Similar to Immigrants from Bangladesh by Male Disability
In terms of male disability, the demographic groups most similar to Immigrants from Bangladesh are Mongolian (10.3%, a difference of 0.020%), Immigrants from El Salvador (10.3%, a difference of 0.070%), Turkish (10.3%, a difference of 0.080%), Cambodian (10.3%, a difference of 0.16%), and Immigrants from Peru (10.3%, a difference of 0.19%).
| Demographics | Rating | Rank | Male Disability |
| Ethiopians | 99.8 /100 | #36 | Exceptional 10.2% |
| Immigrants | Indonesia | 99.8 /100 | #37 | Exceptional 10.2% |
| Immigrants | Kuwait | 99.8 /100 | #38 | Exceptional 10.2% |
| Afghans | 99.8 /100 | #39 | Exceptional 10.2% |
| Immigrants | Nepal | 99.8 /100 | #40 | Exceptional 10.3% |
| Taiwanese | 99.8 /100 | #41 | Exceptional 10.3% |
| Mongolians | 99.7 /100 | #42 | Exceptional 10.3% |
| Immigrants | Bangladesh | 99.7 /100 | #43 | Exceptional 10.3% |
| Immigrants | El Salvador | 99.7 /100 | #44 | Exceptional 10.3% |
| Turks | 99.7 /100 | #45 | Exceptional 10.3% |
| Cambodians | 99.7 /100 | #46 | Exceptional 10.3% |
| Immigrants | Peru | 99.7 /100 | #47 | Exceptional 10.3% |
| Israelis | 99.7 /100 | #48 | Exceptional 10.3% |
| Immigrants | Spain | 99.7 /100 | #49 | Exceptional 10.3% |
| South Americans | 99.6 /100 | #50 | Exceptional 10.3% |
Demographics Similar to Romanians by Male Disability
In terms of male disability, the demographic groups most similar to Romanians are Immigrants from Burma/Myanmar (11.2%, a difference of 0.020%), Maltese (11.2%, a difference of 0.040%), Haitian (11.2%, a difference of 0.10%), New Zealander (11.2%, a difference of 0.12%), and Immigrants from Honduras (11.2%, a difference of 0.12%).
| Demographics | Rating | Rank | Male Disability |
| Luxembourgers | 61.9 /100 | #165 | Good 11.1% |
| Immigrants | Hungary | 61.2 /100 | #166 | Good 11.1% |
| Immigrants | Southern Europe | 54.4 /100 | #167 | Average 11.2% |
| Immigrants | Latin America | 54.0 /100 | #168 | Average 11.2% |
| Barbadians | 53.4 /100 | #169 | Average 11.2% |
| New Zealanders | 52.9 /100 | #170 | Average 11.2% |
| Haitians | 52.5 /100 | #171 | Average 11.2% |
| Romanians | 50.7 /100 | #172 | Average 11.2% |
| Immigrants | Burma/Myanmar | 50.4 /100 | #173 | Average 11.2% |
| Maltese | 50.0 /100 | #174 | Average 11.2% |
| Immigrants | Honduras | 48.7 /100 | #175 | Average 11.2% |
| Syrians | 46.6 /100 | #176 | Average 11.2% |
| Immigrants | Norway | 44.2 /100 | #177 | Average 11.3% |
| Australians | 42.2 /100 | #178 | Average 11.3% |
| Immigrants | Caribbean | 41.4 /100 | #179 | Average 11.3% |