Immigrants from Bangladesh vs Guatemalan Per Capita Income
COMPARE
Immigrants from Bangladesh
Guatemalan
Per Capita Income
Per Capita Income Comparison
Immigrants from Bangladesh
Guatemalans
$41,709
PER CAPITA INCOME
10.1/ 100
METRIC RATING
214th/ 347
METRIC RANK
$37,766
PER CAPITA INCOME
0.1/ 100
METRIC RATING
285th/ 347
METRIC RANK
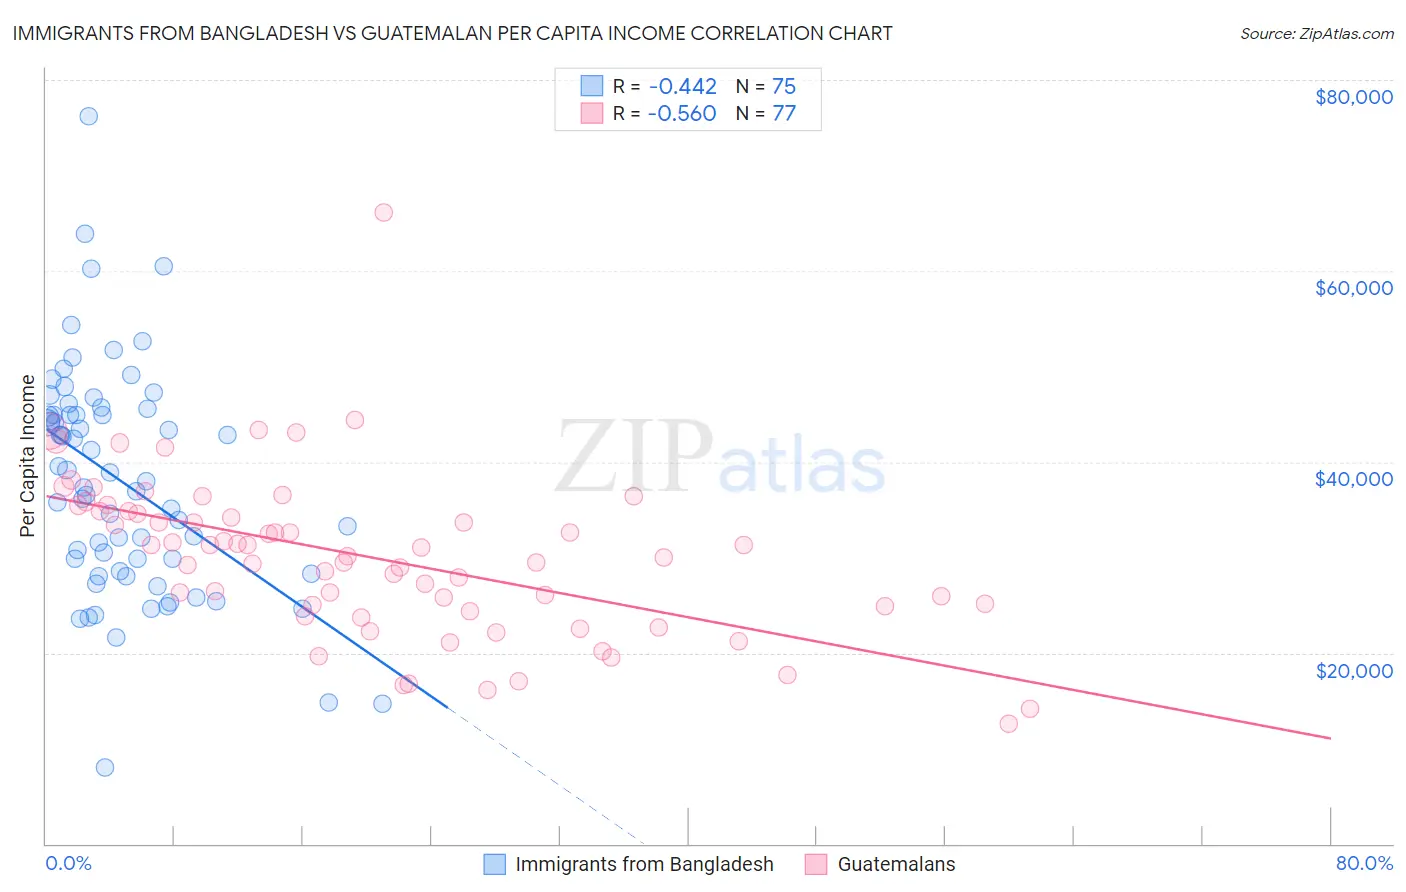
Immigrants from Bangladesh vs Guatemalan Per Capita Income Correlation Chart
The statistical analysis conducted on geographies consisting of 203,679,462 people shows a moderate negative correlation between the proportion of Immigrants from Bangladesh and per capita income in the United States with a correlation coefficient (R) of -0.442 and weighted average of $41,709. Similarly, the statistical analysis conducted on geographies consisting of 409,586,498 people shows a substantial negative correlation between the proportion of Guatemalans and per capita income in the United States with a correlation coefficient (R) of -0.560 and weighted average of $37,766, a difference of 10.4%.
Per Capita Income Correlation Summary
| Measurement | Immigrants from Bangladesh | Guatemalan |
| Minimum | $8,026 | $12,606 |
| Maximum | $76,210 | $66,145 |
| Range | $68,184 | $53,539 |
| Mean | $37,925 | $29,994 |
| Median | $37,941 | $30,165 |
| Interquartile 25% (IQ1) | $28,589 | $24,578 |
| Interquartile 75% (IQ3) | $44,956 | $34,822 |
| Interquartile Range (IQR) | $16,367 | $10,244 |
| Standard Deviation (Sample) | $11,865 | $8,508 |
| Standard Deviation (Population) | $11,786 | $8,452 |
Similar Demographics by Per Capita Income
Demographics Similar to Immigrants from Bangladesh by Per Capita Income
In terms of per capita income, the demographic groups most similar to Immigrants from Bangladesh are Sudanese ($41,695, a difference of 0.030%), Immigrants from Venezuela ($41,727, a difference of 0.040%), Tongan ($41,693, a difference of 0.040%), Guamanian/Chamorro ($41,678, a difference of 0.070%), and Trinidadian and Tobagonian ($41,655, a difference of 0.13%).
| Demographics | Rating | Rank | Per Capita Income |
| Venezuelans | 14.4 /100 | #207 | Poor $42,074 |
| Panamanians | 13.9 /100 | #208 | Poor $42,035 |
| Immigrants | Sudan | 13.2 /100 | #209 | Poor $41,986 |
| Ecuadorians | 12.9 /100 | #210 | Poor $41,958 |
| Immigrants | Panama | 11.6 /100 | #211 | Poor $41,853 |
| Immigrants | Senegal | 11.3 /100 | #212 | Poor $41,830 |
| Immigrants | Venezuela | 10.2 /100 | #213 | Poor $41,727 |
| Immigrants | Bangladesh | 10.1 /100 | #214 | Poor $41,709 |
| Sudanese | 9.9 /100 | #215 | Tragic $41,695 |
| Tongans | 9.9 /100 | #216 | Tragic $41,693 |
| Guamanians/Chamorros | 9.7 /100 | #217 | Tragic $41,678 |
| Trinidadians and Tobagonians | 9.5 /100 | #218 | Tragic $41,655 |
| Puget Sound Salish | 8.1 /100 | #219 | Tragic $41,495 |
| Immigrants | Barbados | 7.9 /100 | #220 | Tragic $41,478 |
| Immigrants | Trinidad and Tobago | 7.9 /100 | #221 | Tragic $41,476 |
Demographics Similar to Guatemalans by Per Capita Income
In terms of per capita income, the demographic groups most similar to Guatemalans are African ($37,785, a difference of 0.050%), Central American Indian ($37,699, a difference of 0.18%), Dominican ($37,697, a difference of 0.19%), Blackfeet ($37,695, a difference of 0.19%), and Pennsylvania German ($37,842, a difference of 0.20%).
| Demographics | Rating | Rank | Per Capita Income |
| Immigrants | Nicaragua | 0.2 /100 | #278 | Tragic $38,065 |
| Colville | 0.2 /100 | #279 | Tragic $38,047 |
| Potawatomi | 0.2 /100 | #280 | Tragic $38,046 |
| Immigrants | Dominica | 0.2 /100 | #281 | Tragic $37,952 |
| Immigrants | Laos | 0.1 /100 | #282 | Tragic $37,857 |
| Pennsylvania Germans | 0.1 /100 | #283 | Tragic $37,842 |
| Africans | 0.1 /100 | #284 | Tragic $37,785 |
| Guatemalans | 0.1 /100 | #285 | Tragic $37,766 |
| Central American Indians | 0.1 /100 | #286 | Tragic $37,699 |
| Dominicans | 0.1 /100 | #287 | Tragic $37,697 |
| Blackfeet | 0.1 /100 | #288 | Tragic $37,695 |
| U.S. Virgin Islanders | 0.1 /100 | #289 | Tragic $37,589 |
| Immigrants | Guatemala | 0.1 /100 | #290 | Tragic $37,550 |
| Cajuns | 0.1 /100 | #291 | Tragic $37,527 |
| Immigrants | Micronesia | 0.1 /100 | #292 | Tragic $37,464 |