Immigrants from Bangladesh vs Immigrants from Colombia Child Poverty Among Boys Under 16
COMPARE
Immigrants from Bangladesh
Immigrants from Colombia
Child Poverty Among Boys Under 16
Child Poverty Among Boys Under 16 Comparison
Immigrants from Bangladesh
Immigrants from Colombia
19.9%
CHILD POVERTY AMONG BOYS UNDER 16
0.0/ 100
METRIC RATING
274th/ 347
METRIC RANK
16.4%
CHILD POVERTY AMONG BOYS UNDER 16
50.8/ 100
METRIC RATING
172nd/ 347
METRIC RANK
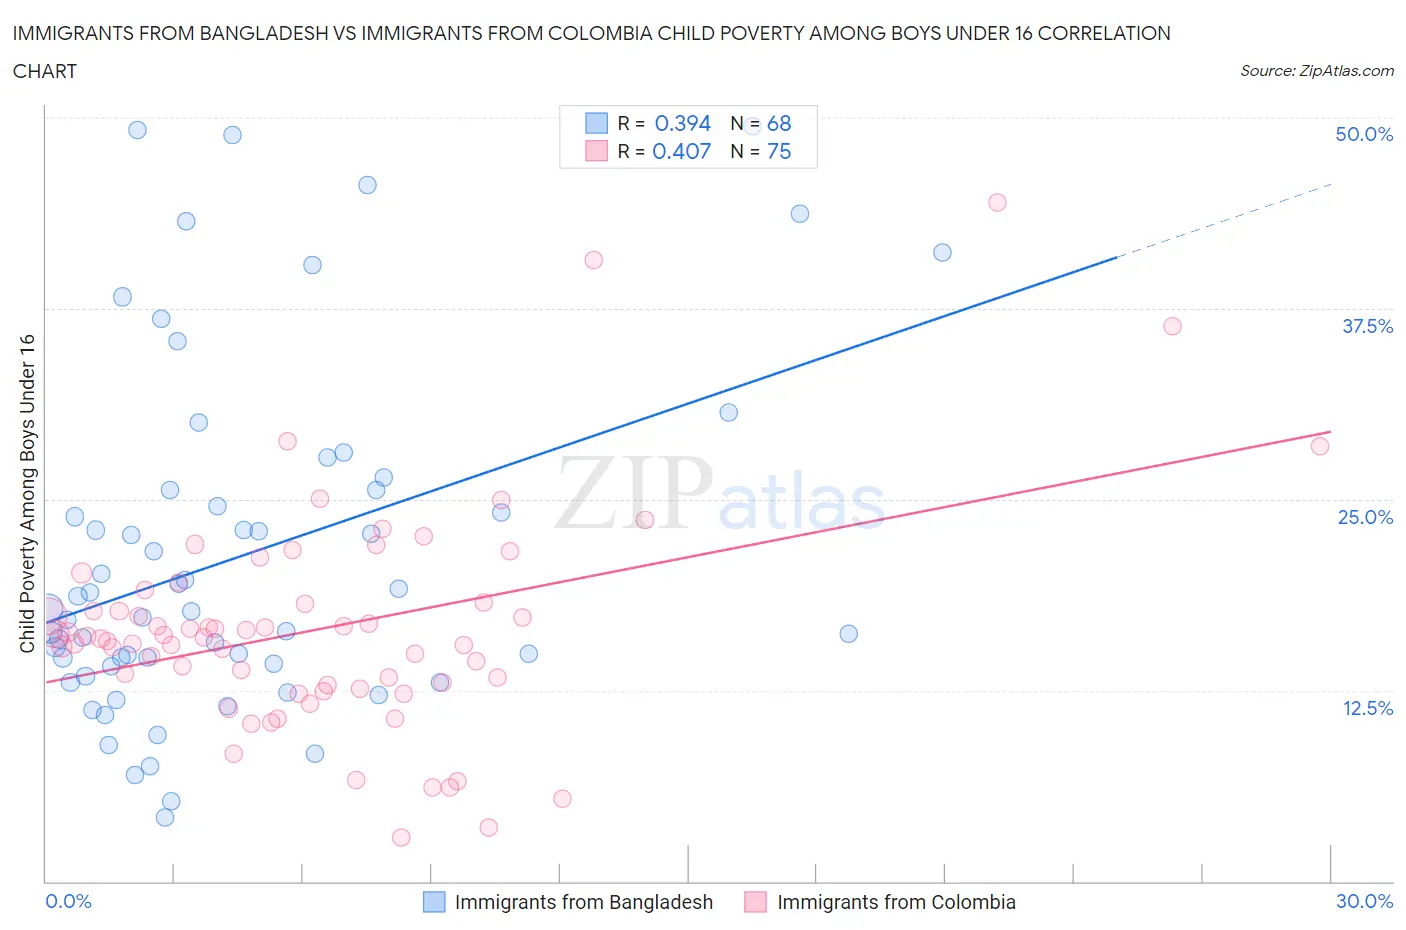
Immigrants from Bangladesh vs Immigrants from Colombia Child Poverty Among Boys Under 16 Correlation Chart
The statistical analysis conducted on geographies consisting of 202,330,281 people shows a mild positive correlation between the proportion of Immigrants from Bangladesh and poverty level among boys under the age of 16 in the United States with a correlation coefficient (R) of 0.394 and weighted average of 19.9%. Similarly, the statistical analysis conducted on geographies consisting of 373,174,720 people shows a moderate positive correlation between the proportion of Immigrants from Colombia and poverty level among boys under the age of 16 in the United States with a correlation coefficient (R) of 0.407 and weighted average of 16.4%, a difference of 21.3%.
Child Poverty Among Boys Under 16 Correlation Summary
| Measurement | Immigrants from Bangladesh | Immigrants from Colombia |
| Minimum | 4.2% | 2.8% |
| Maximum | 49.5% | 44.4% |
| Range | 45.3% | 41.6% |
| Mean | 21.3% | 16.5% |
| Median | 17.8% | 16.0% |
| Interquartile 25% (IQ1) | 14.1% | 12.9% |
| Interquartile 75% (IQ3) | 25.6% | 18.2% |
| Interquartile Range (IQR) | 11.4% | 5.4% |
| Standard Deviation (Sample) | 11.3% | 7.2% |
| Standard Deviation (Population) | 11.2% | 7.1% |
Similar Demographics by Child Poverty Among Boys Under 16
Demographics Similar to Immigrants from Bangladesh by Child Poverty Among Boys Under 16
In terms of child poverty among boys under 16, the demographic groups most similar to Immigrants from Bangladesh are Jamaican (20.0%, a difference of 0.12%), Belizean (19.9%, a difference of 0.25%), Subsaharan African (20.0%, a difference of 0.29%), Immigrants from Ecuador (19.8%, a difference of 0.39%), and Immigrants from Barbados (20.0%, a difference of 0.39%).
| Demographics | Rating | Rank | Child Poverty Among Boys Under 16 |
| Vietnamese | 0.1 /100 | #267 | Tragic 19.6% |
| Spanish American Indians | 0.1 /100 | #268 | Tragic 19.6% |
| Immigrants | Cabo Verde | 0.1 /100 | #269 | Tragic 19.7% |
| Cherokee | 0.1 /100 | #270 | Tragic 19.7% |
| Chickasaw | 0.1 /100 | #271 | Tragic 19.8% |
| Immigrants | Ecuador | 0.1 /100 | #272 | Tragic 19.8% |
| Belizeans | 0.1 /100 | #273 | Tragic 19.9% |
| Immigrants | Bangladesh | 0.0 /100 | #274 | Tragic 19.9% |
| Jamaicans | 0.0 /100 | #275 | Tragic 20.0% |
| Sub-Saharan Africans | 0.0 /100 | #276 | Tragic 20.0% |
| Immigrants | Barbados | 0.0 /100 | #277 | Tragic 20.0% |
| Immigrants | West Indies | 0.0 /100 | #278 | Tragic 20.0% |
| Bangladeshis | 0.0 /100 | #279 | Tragic 20.0% |
| Central Americans | 0.0 /100 | #280 | Tragic 20.1% |
| Immigrants | Zaire | 0.0 /100 | #281 | Tragic 20.1% |
Demographics Similar to Immigrants from Colombia by Child Poverty Among Boys Under 16
In terms of child poverty among boys under 16, the demographic groups most similar to Immigrants from Colombia are Tsimshian (16.4%, a difference of 0.030%), Immigrants from Ethiopia (16.4%, a difference of 0.050%), Uruguayan (16.4%, a difference of 0.090%), Immigrants from Bosnia and Herzegovina (16.4%, a difference of 0.11%), and Immigrants from Syria (16.5%, a difference of 0.19%).
| Demographics | Rating | Rank | Child Poverty Among Boys Under 16 |
| Colombians | 65.2 /100 | #165 | Good 16.1% |
| Immigrants | Germany | 63.6 /100 | #166 | Good 16.2% |
| Afghans | 55.4 /100 | #167 | Average 16.3% |
| South Americans | 55.3 /100 | #168 | Average 16.3% |
| Immigrants | Saudi Arabia | 53.6 /100 | #169 | Average 16.4% |
| Immigrants | Bosnia and Herzegovina | 51.7 /100 | #170 | Average 16.4% |
| Immigrants | Ethiopia | 51.3 /100 | #171 | Average 16.4% |
| Immigrants | Colombia | 50.8 /100 | #172 | Average 16.4% |
| Tsimshian | 50.5 /100 | #173 | Average 16.4% |
| Uruguayans | 50.0 /100 | #174 | Average 16.4% |
| Immigrants | Syria | 49.0 /100 | #175 | Average 16.5% |
| Whites/Caucasians | 48.2 /100 | #176 | Average 16.5% |
| Ethiopians | 47.8 /100 | #177 | Average 16.5% |
| Scotch-Irish | 47.5 /100 | #178 | Average 16.5% |
| Hungarians | 47.3 /100 | #179 | Average 16.5% |