Immigrants from Bangladesh vs Immigrants from Colombia Associate's Degree
COMPARE
Immigrants from Bangladesh
Immigrants from Colombia
Associate's Degree
Associate's Degree Comparison
Immigrants from Bangladesh
Immigrants from Colombia
45.2%
ASSOCIATE'S DEGREE
21.3/ 100
METRIC RATING
198th/ 347
METRIC RANK
46.0%
ASSOCIATE'S DEGREE
41.3/ 100
METRIC RATING
181st/ 347
METRIC RANK
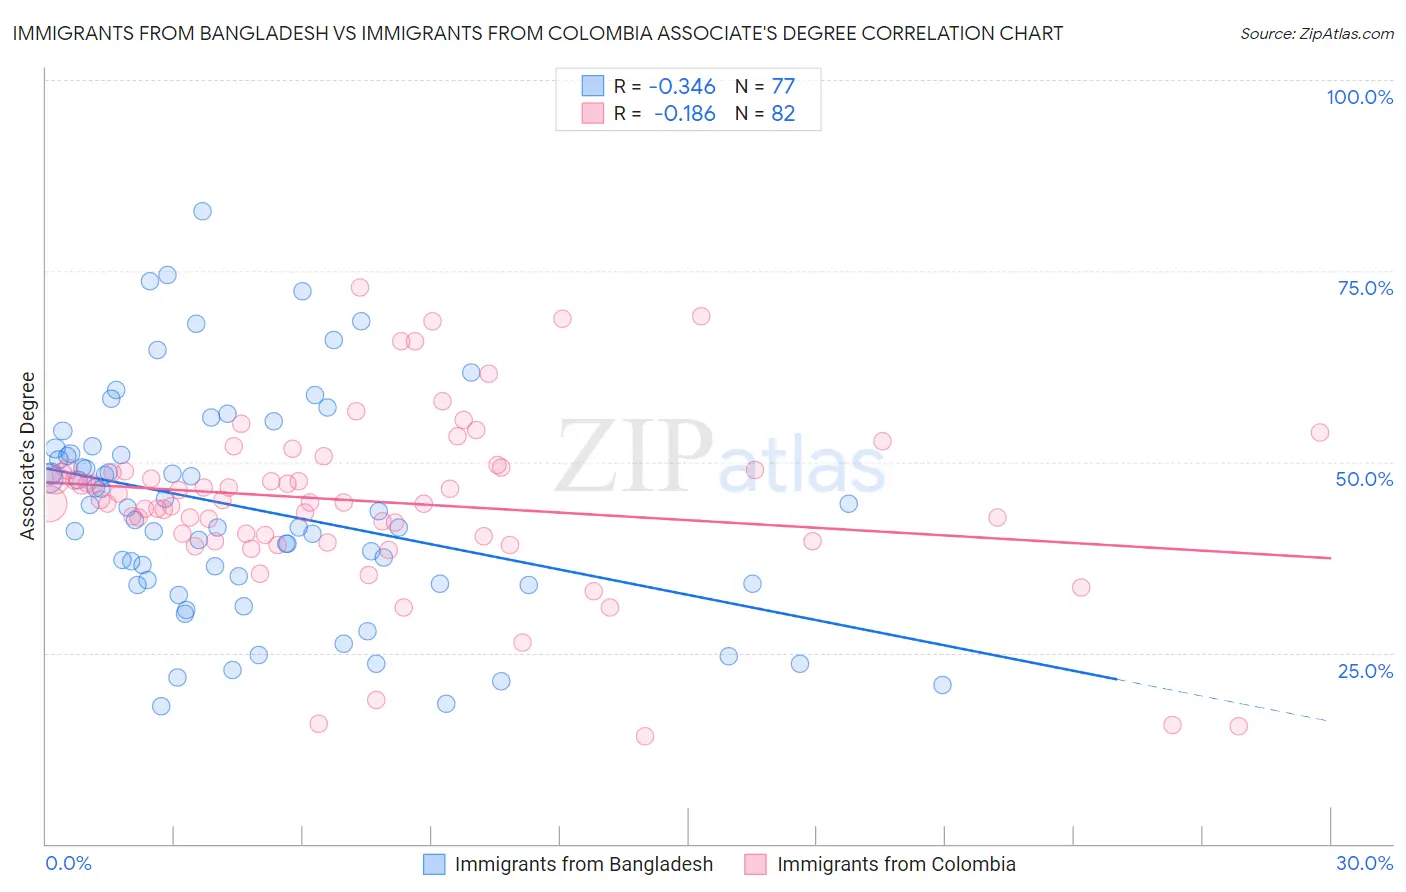
Immigrants from Bangladesh vs Immigrants from Colombia Associate's Degree Correlation Chart
The statistical analysis conducted on geographies consisting of 203,673,511 people shows a mild negative correlation between the proportion of Immigrants from Bangladesh and percentage of population with at least associate's degree education in the United States with a correlation coefficient (R) of -0.346 and weighted average of 45.2%. Similarly, the statistical analysis conducted on geographies consisting of 378,676,952 people shows a poor negative correlation between the proportion of Immigrants from Colombia and percentage of population with at least associate's degree education in the United States with a correlation coefficient (R) of -0.186 and weighted average of 46.0%, a difference of 1.8%.
Associate's Degree Correlation Summary
| Measurement | Immigrants from Bangladesh | Immigrants from Colombia |
| Minimum | 18.0% | 14.1% |
| Maximum | 82.8% | 72.8% |
| Range | 64.8% | 58.7% |
| Mean | 43.9% | 44.8% |
| Median | 43.6% | 44.8% |
| Interquartile 25% (IQ1) | 34.0% | 40.3% |
| Interquartile 75% (IQ3) | 51.4% | 49.1% |
| Interquartile Range (IQR) | 17.4% | 8.8% |
| Standard Deviation (Sample) | 14.3% | 11.4% |
| Standard Deviation (Population) | 14.2% | 11.3% |
Demographics Similar to Immigrants from Bangladesh and Immigrants from Colombia by Associate's Degree
In terms of associate's degree, the demographic groups most similar to Immigrants from Bangladesh are Immigrants from Senegal (45.2%, a difference of 0.020%), Scotch-Irish (45.3%, a difference of 0.10%), French (45.4%, a difference of 0.45%), German (45.5%, a difference of 0.54%), and Immigrants from Peru (45.5%, a difference of 0.65%). Similarly, the demographic groups most similar to Immigrants from Colombia are Swiss (46.0%, a difference of 0.070%), Yugoslavian (46.0%, a difference of 0.080%), Czechoslovakian (46.0%, a difference of 0.10%), Costa Rican (46.0%, a difference of 0.21%), and Welsh (45.9%, a difference of 0.27%).
| Demographics | Rating | Rank | Associate's Degree |
| Sri Lankans | 47.6 /100 | #179 | Average 46.3% |
| Bermudans | 46.4 /100 | #180 | Average 46.2% |
| Immigrants | Colombia | 41.3 /100 | #181 | Average 46.0% |
| Swiss | 40.4 /100 | #182 | Average 46.0% |
| Yugoslavians | 40.2 /100 | #183 | Average 46.0% |
| Czechoslovakians | 40.0 /100 | #184 | Average 46.0% |
| Costa Ricans | 38.6 /100 | #185 | Fair 46.0% |
| Welsh | 37.9 /100 | #186 | Fair 45.9% |
| Immigrants | Uruguay | 35.5 /100 | #187 | Fair 45.8% |
| Ghanaians | 35.5 /100 | #188 | Fair 45.8% |
| Immigrants | Oceania | 34.7 /100 | #189 | Fair 45.8% |
| Vietnamese | 34.0 /100 | #190 | Fair 45.8% |
| Koreans | 33.8 /100 | #191 | Fair 45.8% |
| Celtics | 33.3 /100 | #192 | Fair 45.8% |
| Immigrants | Cameroon | 31.0 /100 | #193 | Fair 45.7% |
| Immigrants | Peru | 27.6 /100 | #194 | Fair 45.5% |
| Germans | 26.5 /100 | #195 | Fair 45.5% |
| French | 25.6 /100 | #196 | Fair 45.4% |
| Scotch-Irish | 22.3 /100 | #197 | Fair 45.3% |
| Immigrants | Bangladesh | 21.3 /100 | #198 | Fair 45.2% |
| Immigrants | Senegal | 21.2 /100 | #199 | Fair 45.2% |