Immigrants from Romania vs Palestinian Householder Income Over 65 years
COMPARE
Immigrants from Romania
Palestinian
Householder Income Over 65 years
Householder Income Over 65 years Comparison
Immigrants from Romania
Palestinians
$64,462
HOUSEHOLDER INCOME OVER 65 YEARS
97.5/ 100
METRIC RATING
88th/ 347
METRIC RANK
$63,800
HOUSEHOLDER INCOME OVER 65 YEARS
95.1/ 100
METRIC RATING
108th/ 347
METRIC RANK
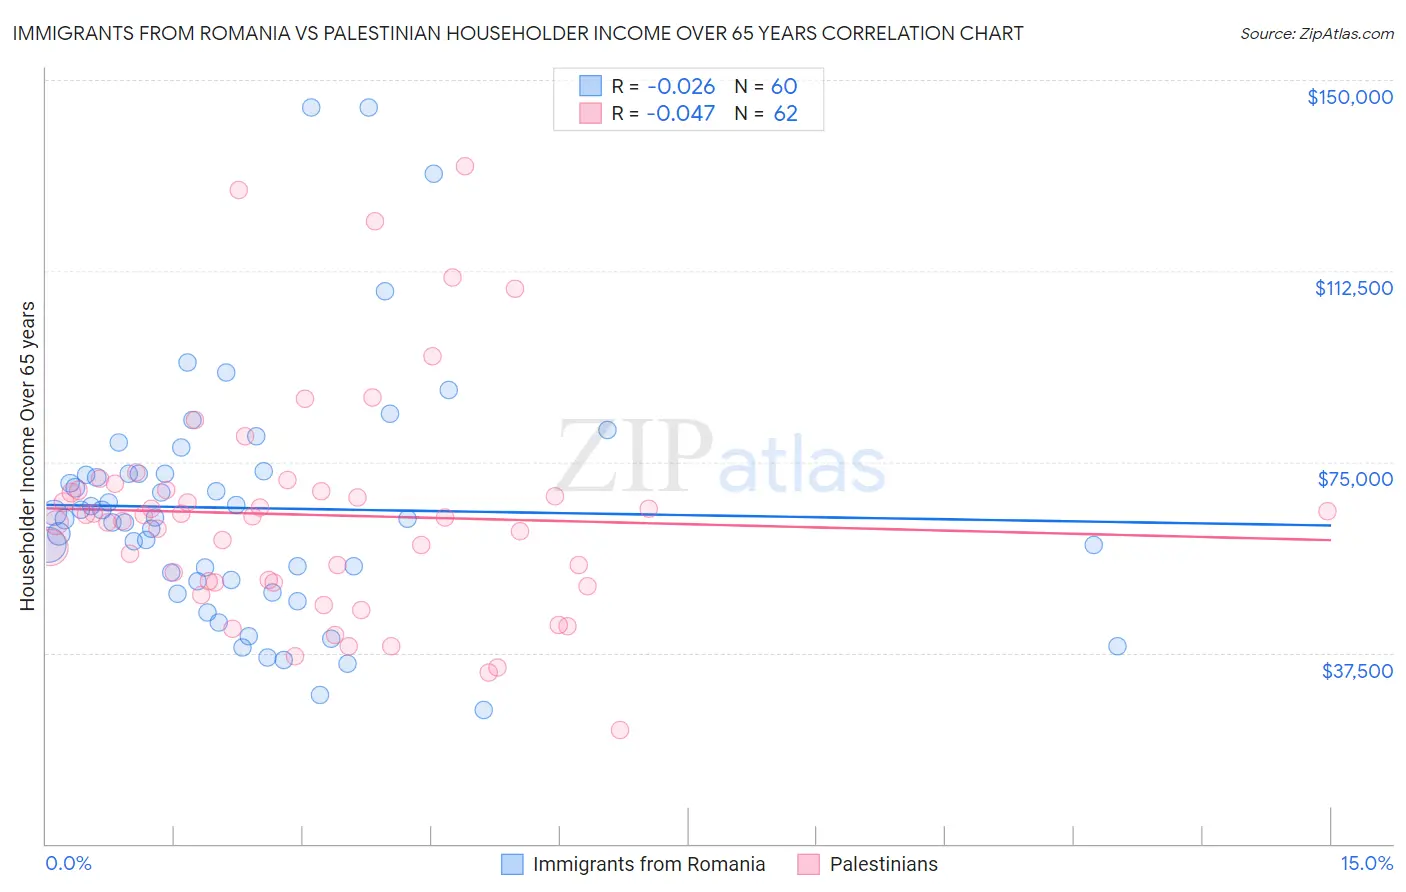
Immigrants from Romania vs Palestinian Householder Income Over 65 years Correlation Chart
The statistical analysis conducted on geographies consisting of 256,630,190 people shows no correlation between the proportion of Immigrants from Romania and household income with householder over the age of 65 in the United States with a correlation coefficient (R) of -0.026 and weighted average of $64,462. Similarly, the statistical analysis conducted on geographies consisting of 216,153,975 people shows no correlation between the proportion of Palestinians and household income with householder over the age of 65 in the United States with a correlation coefficient (R) of -0.047 and weighted average of $63,800, a difference of 1.0%.
Householder Income Over 65 years Correlation Summary
| Measurement | Immigrants from Romania | Palestinian |
| Minimum | $26,354 | $22,303 |
| Maximum | $144,651 | $133,182 |
| Range | $118,297 | $110,879 |
| Mean | $65,931 | $64,585 |
| Median | $63,917 | $64,219 |
| Interquartile 25% (IQ1) | $51,757 | $51,418 |
| Interquartile 75% (IQ3) | $72,732 | $69,430 |
| Interquartile Range (IQR) | $20,976 | $18,012 |
| Standard Deviation (Sample) | $23,898 | $21,891 |
| Standard Deviation (Population) | $23,698 | $21,714 |
Demographics Similar to Immigrants from Romania and Palestinians by Householder Income Over 65 years
In terms of householder income over 65 years, the demographic groups most similar to Immigrants from Romania are Paraguayan ($64,443, a difference of 0.030%), Immigrants from Kuwait ($64,433, a difference of 0.040%), Immigrants from Oceania ($64,416, a difference of 0.070%), Immigrants from Bulgaria ($64,379, a difference of 0.13%), and Jordanian ($64,313, a difference of 0.23%). Similarly, the demographic groups most similar to Palestinians are Pakistani ($63,844, a difference of 0.070%), Italian ($63,885, a difference of 0.13%), Immigrants from Argentina ($63,885, a difference of 0.13%), Immigrants from Cameroon ($63,907, a difference of 0.17%), and British ($63,940, a difference of 0.22%).
| Demographics | Rating | Rank | Householder Income Over 65 years |
| Immigrants | Romania | 97.5 /100 | #88 | Exceptional $64,462 |
| Paraguayans | 97.4 /100 | #89 | Exceptional $64,443 |
| Immigrants | Kuwait | 97.4 /100 | #90 | Exceptional $64,433 |
| Immigrants | Oceania | 97.4 /100 | #91 | Exceptional $64,416 |
| Immigrants | Bulgaria | 97.3 /100 | #92 | Exceptional $64,379 |
| Jordanians | 97.1 /100 | #93 | Exceptional $64,313 |
| Immigrants | Egypt | 97.0 /100 | #94 | Exceptional $64,299 |
| Immigrants | Latvia | 97.0 /100 | #95 | Exceptional $64,298 |
| Immigrants | Hungary | 97.0 /100 | #96 | Exceptional $64,277 |
| Sri Lankans | 96.7 /100 | #97 | Exceptional $64,201 |
| Romanians | 96.5 /100 | #98 | Exceptional $64,142 |
| Assyrians/Chaldeans/Syriacs | 96.4 /100 | #99 | Exceptional $64,108 |
| Immigrants | South Eastern Asia | 96.3 /100 | #100 | Exceptional $64,089 |
| Immigrants | Italy | 96.2 /100 | #101 | Exceptional $64,065 |
| Chileans | 95.8 /100 | #102 | Exceptional $63,957 |
| British | 95.7 /100 | #103 | Exceptional $63,940 |
| Immigrants | Cameroon | 95.6 /100 | #104 | Exceptional $63,907 |
| Italians | 95.5 /100 | #105 | Exceptional $63,885 |
| Immigrants | Argentina | 95.5 /100 | #106 | Exceptional $63,885 |
| Pakistanis | 95.3 /100 | #107 | Exceptional $63,844 |
| Palestinians | 95.1 /100 | #108 | Exceptional $63,800 |