Immigrants from Portugal vs Palestinian Householder Income Over 65 years
COMPARE
Immigrants from Portugal
Palestinian
Householder Income Over 65 years
Householder Income Over 65 years Comparison
Immigrants from Portugal
Palestinians
$55,924
HOUSEHOLDER INCOME OVER 65 YEARS
0.5/ 100
METRIC RATING
251st/ 347
METRIC RANK
$63,800
HOUSEHOLDER INCOME OVER 65 YEARS
95.1/ 100
METRIC RATING
108th/ 347
METRIC RANK
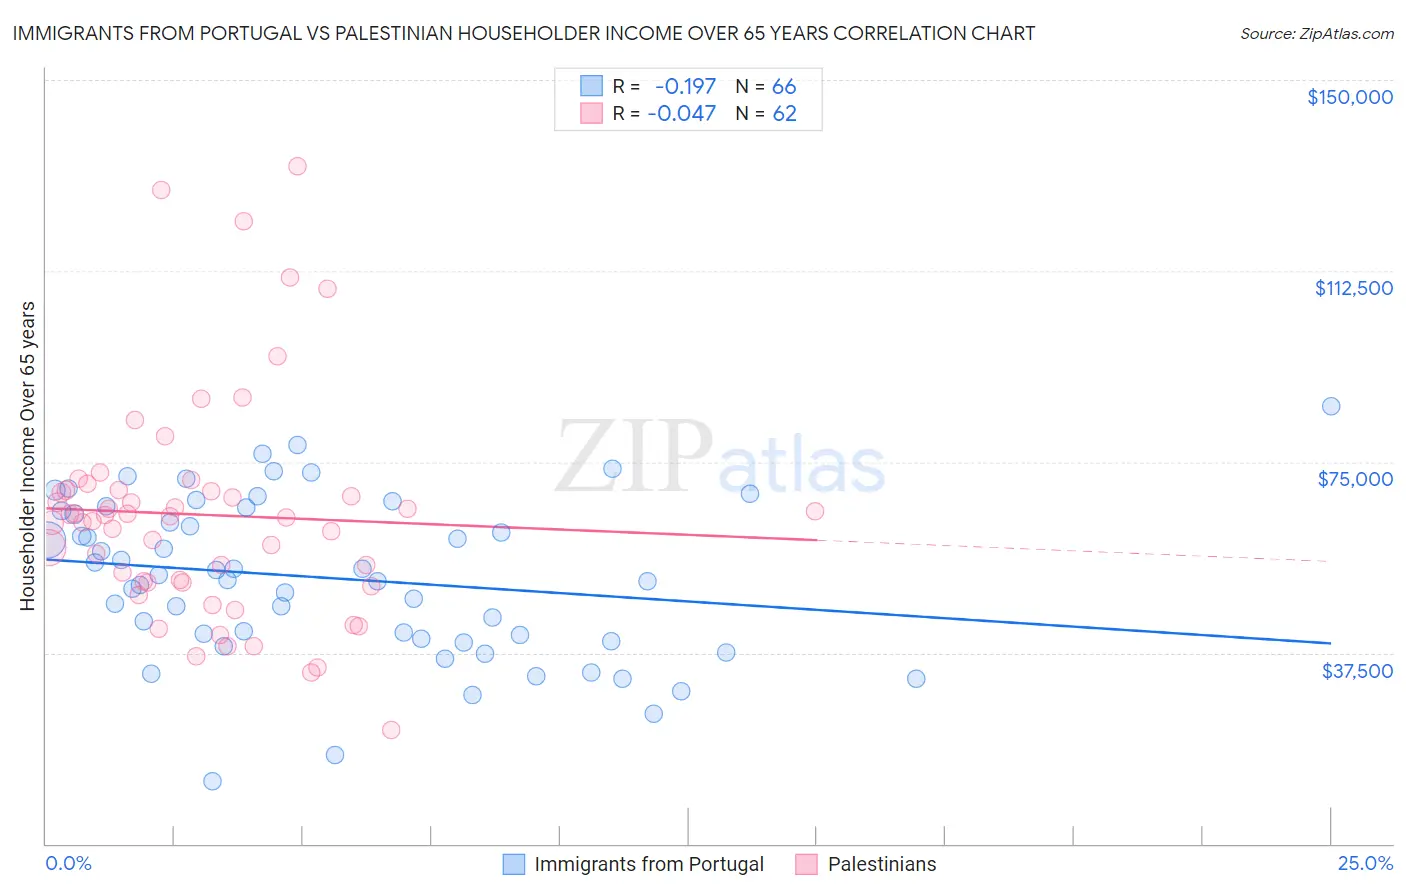
Immigrants from Portugal vs Palestinian Householder Income Over 65 years Correlation Chart
The statistical analysis conducted on geographies consisting of 174,564,681 people shows a poor negative correlation between the proportion of Immigrants from Portugal and household income with householder over the age of 65 in the United States with a correlation coefficient (R) of -0.197 and weighted average of $55,924. Similarly, the statistical analysis conducted on geographies consisting of 216,153,975 people shows no correlation between the proportion of Palestinians and household income with householder over the age of 65 in the United States with a correlation coefficient (R) of -0.047 and weighted average of $63,800, a difference of 14.1%.
Householder Income Over 65 years Correlation Summary
| Measurement | Immigrants from Portugal | Palestinian |
| Minimum | $12,293 | $22,303 |
| Maximum | $85,927 | $133,182 |
| Range | $73,634 | $110,879 |
| Mean | $52,138 | $64,585 |
| Median | $52,364 | $64,219 |
| Interquartile 25% (IQ1) | $40,233 | $51,418 |
| Interquartile 75% (IQ3) | $65,422 | $69,430 |
| Interquartile Range (IQR) | $25,189 | $18,012 |
| Standard Deviation (Sample) | $15,656 | $21,891 |
| Standard Deviation (Population) | $15,537 | $21,714 |
Similar Demographics by Householder Income Over 65 years
Demographics Similar to Immigrants from Portugal by Householder Income Over 65 years
In terms of householder income over 65 years, the demographic groups most similar to Immigrants from Portugal are Immigrants from Bosnia and Herzegovina ($55,986, a difference of 0.11%), Mexican American Indian ($56,089, a difference of 0.30%), Vietnamese ($56,143, a difference of 0.39%), Osage ($55,677, a difference of 0.44%), and Yakama ($56,234, a difference of 0.55%).
| Demographics | Rating | Rank | Householder Income Over 65 years |
| Hmong | 0.8 /100 | #244 | Tragic $56,339 |
| Immigrants | Uzbekistan | 0.8 /100 | #245 | Tragic $56,331 |
| Central Americans | 0.8 /100 | #246 | Tragic $56,321 |
| Yakama | 0.7 /100 | #247 | Tragic $56,234 |
| Vietnamese | 0.6 /100 | #248 | Tragic $56,143 |
| Mexican American Indians | 0.6 /100 | #249 | Tragic $56,089 |
| Immigrants | Bosnia and Herzegovina | 0.5 /100 | #250 | Tragic $55,986 |
| Immigrants | Portugal | 0.5 /100 | #251 | Tragic $55,924 |
| Osage | 0.4 /100 | #252 | Tragic $55,677 |
| Immigrants | Trinidad and Tobago | 0.4 /100 | #253 | Tragic $55,598 |
| Americans | 0.3 /100 | #254 | Tragic $55,527 |
| Immigrants | Bangladesh | 0.3 /100 | #255 | Tragic $55,394 |
| German Russians | 0.3 /100 | #256 | Tragic $55,356 |
| Trinidadians and Tobagonians | 0.3 /100 | #257 | Tragic $55,327 |
| Ecuadorians | 0.2 /100 | #258 | Tragic $54,958 |
Demographics Similar to Palestinians by Householder Income Over 65 years
In terms of householder income over 65 years, the demographic groups most similar to Palestinians are European ($63,779, a difference of 0.030%), Pakistani ($63,844, a difference of 0.070%), Italian ($63,885, a difference of 0.13%), Immigrants from Argentina ($63,885, a difference of 0.13%), and Immigrants from Cameroon ($63,907, a difference of 0.17%).
| Demographics | Rating | Rank | Householder Income Over 65 years |
| Immigrants | Italy | 96.2 /100 | #101 | Exceptional $64,065 |
| Chileans | 95.8 /100 | #102 | Exceptional $63,957 |
| British | 95.7 /100 | #103 | Exceptional $63,940 |
| Immigrants | Cameroon | 95.6 /100 | #104 | Exceptional $63,907 |
| Italians | 95.5 /100 | #105 | Exceptional $63,885 |
| Immigrants | Argentina | 95.5 /100 | #106 | Exceptional $63,885 |
| Pakistanis | 95.3 /100 | #107 | Exceptional $63,844 |
| Palestinians | 95.1 /100 | #108 | Exceptional $63,800 |
| Europeans | 95.0 /100 | #109 | Exceptional $63,779 |
| Immigrants | Zimbabwe | 94.3 /100 | #110 | Exceptional $63,643 |
| Immigrants | Spain | 93.7 /100 | #111 | Exceptional $63,540 |
| Syrians | 93.4 /100 | #112 | Exceptional $63,494 |
| Immigrants | Serbia | 92.7 /100 | #113 | Exceptional $63,387 |
| Immigrants | Saudi Arabia | 92.4 /100 | #114 | Exceptional $63,355 |
| Croatians | 91.4 /100 | #115 | Exceptional $63,225 |