Immigrants from Bahamas vs Norwegian 4th Grade
COMPARE
Immigrants from Bahamas
Norwegian
4th Grade
4th Grade Comparison
Immigrants from Bahamas
Norwegians
97.3%
4TH GRADE
10.8/ 100
METRIC RATING
208th/ 347
METRIC RANK
98.5%
4TH GRADE
100.0/ 100
METRIC RATING
6th/ 347
METRIC RANK
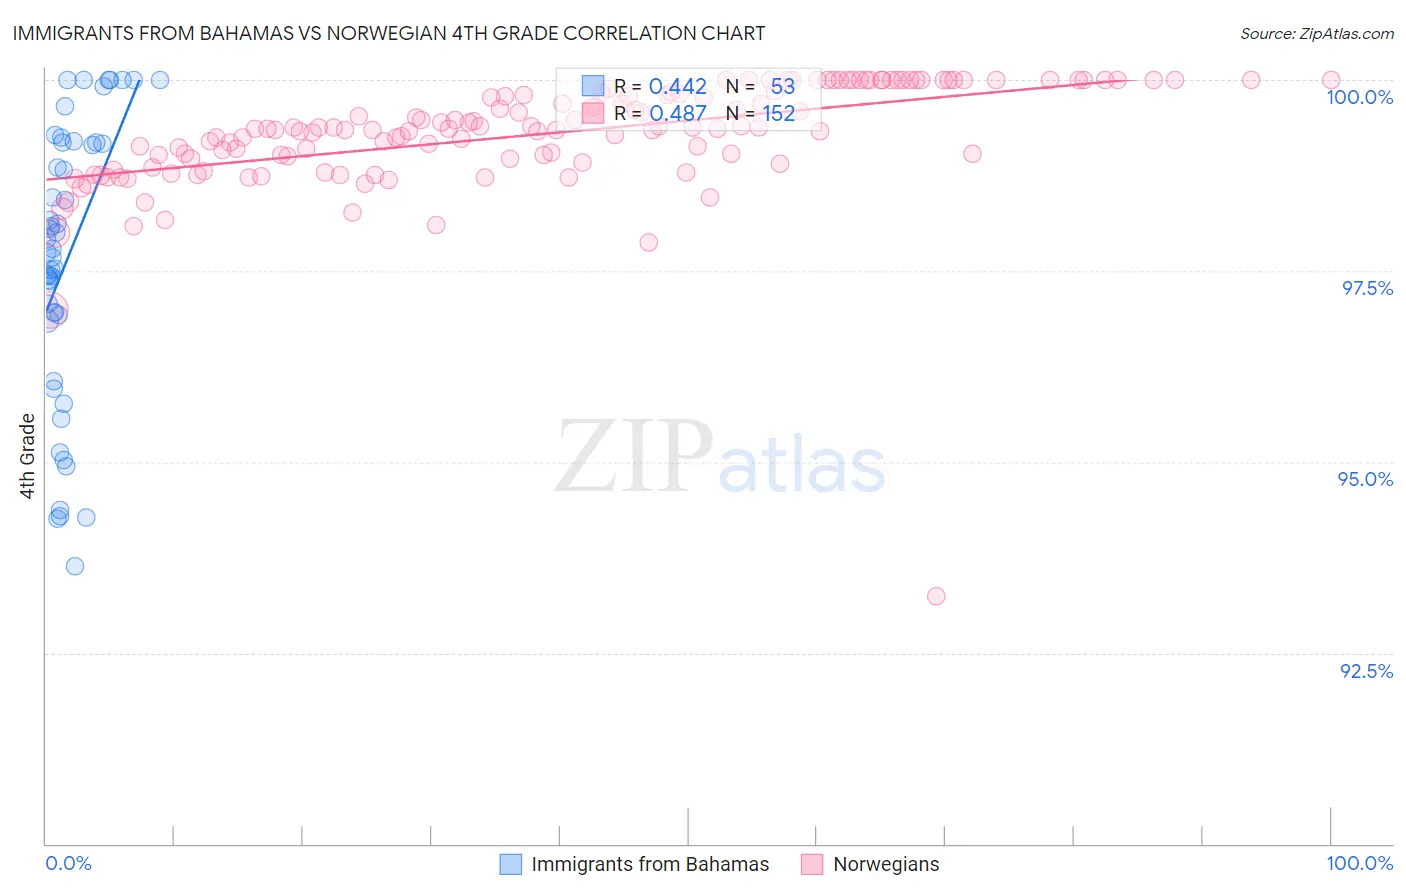
Immigrants from Bahamas vs Norwegian 4th Grade Correlation Chart
The statistical analysis conducted on geographies consisting of 104,665,087 people shows a moderate positive correlation between the proportion of Immigrants from Bahamas and percentage of population with at least 4th grade education in the United States with a correlation coefficient (R) of 0.442 and weighted average of 97.3%. Similarly, the statistical analysis conducted on geographies consisting of 533,395,488 people shows a moderate positive correlation between the proportion of Norwegians and percentage of population with at least 4th grade education in the United States with a correlation coefficient (R) of 0.487 and weighted average of 98.5%, a difference of 1.2%.
4th Grade Correlation Summary
| Measurement | Immigrants from Bahamas | Norwegian |
| Minimum | 93.6% | 93.2% |
| Maximum | 100.0% | 100.0% |
| Range | 6.4% | 6.8% |
| Mean | 97.7% | 99.3% |
| Median | 97.8% | 99.4% |
| Interquartile 25% (IQ1) | 96.9% | 99.0% |
| Interquartile 75% (IQ3) | 99.2% | 99.8% |
| Interquartile Range (IQR) | 2.3% | 0.88% |
| Standard Deviation (Sample) | 1.8% | 0.75% |
| Standard Deviation (Population) | 1.8% | 0.75% |
Similar Demographics by 4th Grade
Demographics Similar to Immigrants from Bahamas by 4th Grade
In terms of 4th grade, the demographic groups most similar to Immigrants from Bahamas are Moroccan (97.3%, a difference of 0.010%), Paiute (97.3%, a difference of 0.020%), Immigrants from Zaire (97.3%, a difference of 0.020%), Laotian (97.3%, a difference of 0.020%), and Immigrants from Oceania (97.3%, a difference of 0.020%).
| Demographics | Rating | Rank | 4th Grade |
| Immigrants | Southern Europe | 16.2 /100 | #201 | Poor 97.4% |
| Immigrants | Chile | 16.1 /100 | #202 | Poor 97.4% |
| Immigrants | Northern Africa | 15.1 /100 | #203 | Poor 97.4% |
| Africans | 14.6 /100 | #204 | Poor 97.4% |
| Paiute | 13.2 /100 | #205 | Poor 97.3% |
| Immigrants | Zaire | 12.8 /100 | #206 | Poor 97.3% |
| Moroccans | 11.3 /100 | #207 | Poor 97.3% |
| Immigrants | Bahamas | 10.8 /100 | #208 | Poor 97.3% |
| Laotians | 9.3 /100 | #209 | Tragic 97.3% |
| Immigrants | Oceania | 9.1 /100 | #210 | Tragic 97.3% |
| Sudanese | 9.0 /100 | #211 | Tragic 97.3% |
| Tohono O'odham | 8.4 /100 | #212 | Tragic 97.3% |
| Costa Ricans | 8.3 /100 | #213 | Tragic 97.3% |
| Immigrants | Nepal | 7.7 /100 | #214 | Tragic 97.3% |
| Immigrants | Morocco | 7.1 /100 | #215 | Tragic 97.3% |
Demographics Similar to Norwegians by 4th Grade
In terms of 4th grade, the demographic groups most similar to Norwegians are Slovak (98.5%, a difference of 0.020%), German (98.5%, a difference of 0.020%), Yup'ik (98.5%, a difference of 0.030%), Inupiat (98.6%, a difference of 0.060%), and Slovene (98.4%, a difference of 0.060%).
| Demographics | Rating | Rank | 4th Grade |
| Crow | 100.0 /100 | #1 | Exceptional 99.6% |
| Welsh | 100.0 /100 | #2 | Exceptional 98.7% |
| Tsimshian | 100.0 /100 | #3 | Exceptional 98.6% |
| Inupiat | 100.0 /100 | #4 | Exceptional 98.6% |
| Yup'ik | 100.0 /100 | #5 | Exceptional 98.5% |
| Norwegians | 100.0 /100 | #6 | Exceptional 98.5% |
| Slovaks | 100.0 /100 | #7 | Exceptional 98.5% |
| Germans | 100.0 /100 | #8 | Exceptional 98.5% |
| Slovenes | 100.0 /100 | #9 | Exceptional 98.4% |
| Alaskan Athabascans | 100.0 /100 | #10 | Exceptional 98.4% |
| English | 100.0 /100 | #11 | Exceptional 98.4% |
| Tlingit-Haida | 100.0 /100 | #12 | Exceptional 98.4% |
| Swedes | 100.0 /100 | #13 | Exceptional 98.4% |
| Carpatho Rusyns | 100.0 /100 | #14 | Exceptional 98.4% |
| Dutch | 100.0 /100 | #15 | Exceptional 98.4% |