Immigrants from Bahamas vs Norwegian In Labor Force | Age 25-29
COMPARE
Immigrants from Bahamas
Norwegian
In Labor Force | Age 25-29
In Labor Force | Age 25-29 Comparison
Immigrants from Bahamas
Norwegians
83.6%
IN LABOR FORCE | AGE 25-29
0.1/ 100
METRIC RATING
260th/ 347
METRIC RANK
86.1%
IN LABOR FORCE | AGE 25-29
100.0/ 100
METRIC RATING
13th/ 347
METRIC RANK
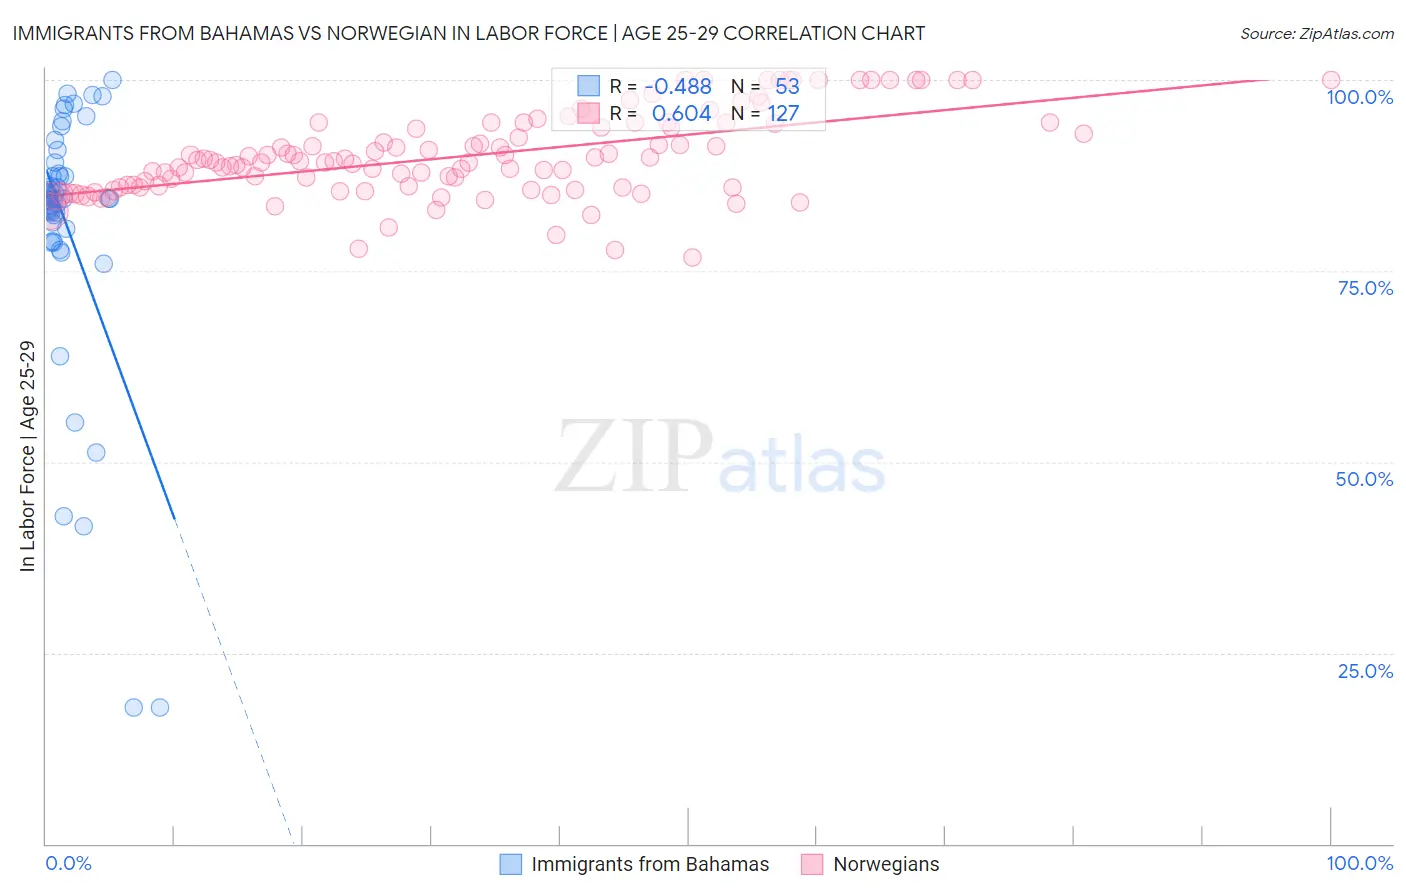
Immigrants from Bahamas vs Norwegian In Labor Force | Age 25-29 Correlation Chart
The statistical analysis conducted on geographies consisting of 104,655,808 people shows a moderate negative correlation between the proportion of Immigrants from Bahamas and labor force participation rate among population between the ages 25 and 29 in the United States with a correlation coefficient (R) of -0.488 and weighted average of 83.6%. Similarly, the statistical analysis conducted on geographies consisting of 532,549,963 people shows a significant positive correlation between the proportion of Norwegians and labor force participation rate among population between the ages 25 and 29 in the United States with a correlation coefficient (R) of 0.604 and weighted average of 86.1%, a difference of 3.0%.
In Labor Force | Age 25-29 Correlation Summary
| Measurement | Immigrants from Bahamas | Norwegian |
| Minimum | 17.9% | 76.8% |
| Maximum | 100.0% | 100.0% |
| Range | 82.1% | 23.2% |
| Mean | 80.7% | 90.1% |
| Median | 84.4% | 89.3% |
| Interquartile 25% (IQ1) | 79.7% | 85.9% |
| Interquartile 75% (IQ3) | 88.5% | 94.3% |
| Interquartile Range (IQR) | 8.8% | 8.4% |
| Standard Deviation (Sample) | 17.6% | 5.5% |
| Standard Deviation (Population) | 17.4% | 5.4% |
Similar Demographics by In Labor Force | Age 25-29
Demographics Similar to Immigrants from Bahamas by In Labor Force | Age 25-29
In terms of in labor force | age 25-29, the demographic groups most similar to Immigrants from Bahamas are Pennsylvania German (83.6%, a difference of 0.0%), Spanish (83.6%, a difference of 0.010%), Immigrants from Guatemala (83.6%, a difference of 0.020%), Immigrants from Haiti (83.7%, a difference of 0.060%), and Delaware (83.7%, a difference of 0.060%).
| Demographics | Rating | Rank | In Labor Force | Age 25-29 |
| Immigrants | Trinidad and Tobago | 0.2 /100 | #253 | Tragic 83.7% |
| Spaniards | 0.2 /100 | #254 | Tragic 83.7% |
| Haitians | 0.2 /100 | #255 | Tragic 83.7% |
| Immigrants | Haiti | 0.2 /100 | #256 | Tragic 83.7% |
| Delaware | 0.2 /100 | #257 | Tragic 83.7% |
| Immigrants | Guatemala | 0.1 /100 | #258 | Tragic 83.6% |
| Spanish | 0.1 /100 | #259 | Tragic 83.6% |
| Immigrants | Bahamas | 0.1 /100 | #260 | Tragic 83.6% |
| Pennsylvania Germans | 0.1 /100 | #261 | Tragic 83.6% |
| Immigrants | Fiji | 0.1 /100 | #262 | Tragic 83.6% |
| West Indians | 0.1 /100 | #263 | Tragic 83.5% |
| Puget Sound Salish | 0.1 /100 | #264 | Tragic 83.5% |
| Cubans | 0.1 /100 | #265 | Tragic 83.5% |
| Aleuts | 0.0 /100 | #266 | Tragic 83.4% |
| Spanish Americans | 0.0 /100 | #267 | Tragic 83.4% |
Demographics Similar to Norwegians by In Labor Force | Age 25-29
In terms of in labor force | age 25-29, the demographic groups most similar to Norwegians are Immigrants from Lithuania (86.1%, a difference of 0.010%), Immigrants from Ethiopia (86.1%, a difference of 0.020%), Liberian (86.1%, a difference of 0.030%), Latvian (86.1%, a difference of 0.030%), and Bolivian (86.1%, a difference of 0.030%).
| Demographics | Rating | Rank | In Labor Force | Age 25-29 |
| Slovenes | 100.0 /100 | #6 | Exceptional 86.4% |
| Immigrants | Bosnia and Herzegovina | 100.0 /100 | #7 | Exceptional 86.3% |
| Immigrants | Cabo Verde | 100.0 /100 | #8 | Exceptional 86.2% |
| Ethiopians | 100.0 /100 | #9 | Exceptional 86.2% |
| Liberians | 100.0 /100 | #10 | Exceptional 86.1% |
| Immigrants | Ethiopia | 100.0 /100 | #11 | Exceptional 86.1% |
| Immigrants | Lithuania | 100.0 /100 | #12 | Exceptional 86.1% |
| Norwegians | 100.0 /100 | #13 | Exceptional 86.1% |
| Latvians | 100.0 /100 | #14 | Exceptional 86.1% |
| Bolivians | 100.0 /100 | #15 | Exceptional 86.1% |
| Immigrants | Bolivia | 100.0 /100 | #16 | Exceptional 86.1% |
| Bermudans | 100.0 /100 | #17 | Exceptional 86.0% |
| Bulgarians | 100.0 /100 | #18 | Exceptional 86.0% |
| Cape Verdeans | 100.0 /100 | #19 | Exceptional 86.0% |
| Immigrants | Ireland | 100.0 /100 | #20 | Exceptional 86.0% |