Immigrants from Bahamas vs Hmong Householder Income Ages 45 - 64 years
COMPARE
Immigrants from Bahamas
Hmong
Householder Income Ages 45 - 64 years
Householder Income Ages 45 - 64 years Comparison
Immigrants from Bahamas
Hmong
$83,177
HOUSEHOLDER INCOME AGES 45 - 64 YEARS
0.0/ 100
METRIC RATING
311th/ 347
METRIC RANK
$88,115
HOUSEHOLDER INCOME AGES 45 - 64 YEARS
0.2/ 100
METRIC RATING
267th/ 347
METRIC RANK
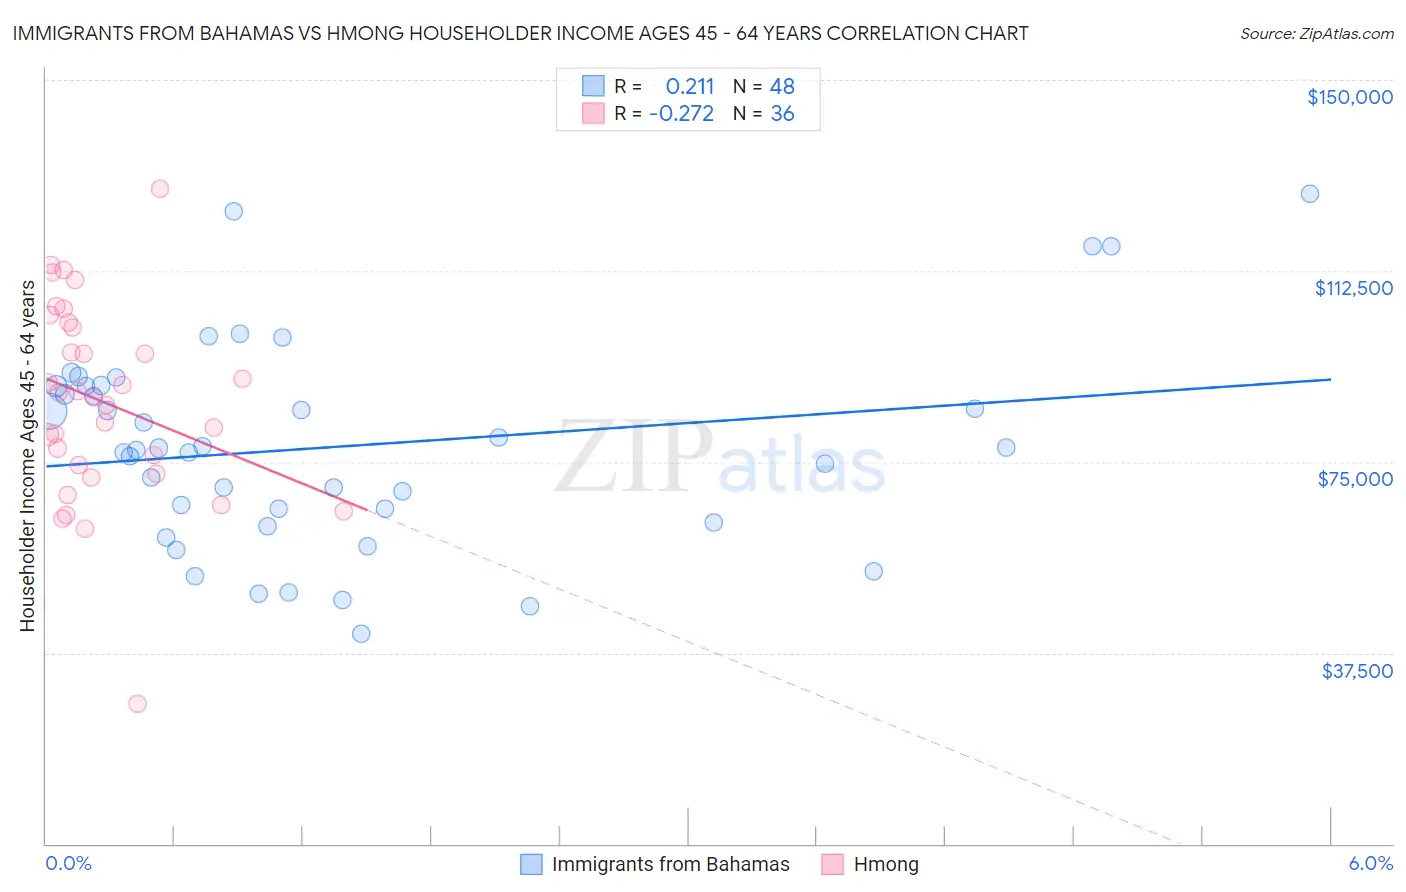
Immigrants from Bahamas vs Hmong Householder Income Ages 45 - 64 years Correlation Chart
The statistical analysis conducted on geographies consisting of 104,531,402 people shows a weak positive correlation between the proportion of Immigrants from Bahamas and household income with householder between the ages 45 and 64 in the United States with a correlation coefficient (R) of 0.211 and weighted average of $83,177. Similarly, the statistical analysis conducted on geographies consisting of 24,653,946 people shows a weak negative correlation between the proportion of Hmong and household income with householder between the ages 45 and 64 in the United States with a correlation coefficient (R) of -0.272 and weighted average of $88,115, a difference of 5.9%.
Householder Income Ages 45 - 64 years Correlation Summary
| Measurement | Immigrants from Bahamas | Hmong |
| Minimum | $41,195 | $27,563 |
| Maximum | $127,688 | $128,750 |
| Range | $86,493 | $101,187 |
| Mean | $78,060 | $86,810 |
| Median | $77,570 | $88,019 |
| Interquartile 25% (IQ1) | $64,406 | $73,534 |
| Interquartile 75% (IQ3) | $89,869 | $101,905 |
| Interquartile Range (IQR) | $25,463 | $28,372 |
| Standard Deviation (Sample) | $20,104 | $19,538 |
| Standard Deviation (Population) | $19,893 | $19,264 |
Similar Demographics by Householder Income Ages 45 - 64 years
Demographics Similar to Immigrants from Bahamas by Householder Income Ages 45 - 64 years
In terms of householder income ages 45 - 64 years, the demographic groups most similar to Immigrants from Bahamas are Immigrants from Haiti ($83,257, a difference of 0.10%), Immigrants from Dominica ($83,311, a difference of 0.16%), Cajun ($83,015, a difference of 0.20%), Immigrants from Cabo Verde ($83,542, a difference of 0.44%), and Shoshone ($83,588, a difference of 0.49%).
| Demographics | Rating | Rank | Householder Income Ages 45 - 64 years |
| Ottawa | 0.0 /100 | #304 | Tragic $83,953 |
| Chippewa | 0.0 /100 | #305 | Tragic $83,943 |
| Ute | 0.0 /100 | #306 | Tragic $83,937 |
| Shoshone | 0.0 /100 | #307 | Tragic $83,588 |
| Immigrants | Cabo Verde | 0.0 /100 | #308 | Tragic $83,542 |
| Immigrants | Dominica | 0.0 /100 | #309 | Tragic $83,311 |
| Immigrants | Haiti | 0.0 /100 | #310 | Tragic $83,257 |
| Immigrants | Bahamas | 0.0 /100 | #311 | Tragic $83,177 |
| Cajuns | 0.0 /100 | #312 | Tragic $83,015 |
| U.S. Virgin Islanders | 0.0 /100 | #313 | Tragic $82,736 |
| Immigrants | Honduras | 0.0 /100 | #314 | Tragic $82,697 |
| Paiute | 0.0 /100 | #315 | Tragic $82,629 |
| Immigrants | Caribbean | 0.0 /100 | #316 | Tragic $82,513 |
| Colville | 0.0 /100 | #317 | Tragic $82,474 |
| Choctaw | 0.0 /100 | #318 | Tragic $82,287 |
Demographics Similar to Hmong by Householder Income Ages 45 - 64 years
In terms of householder income ages 45 - 64 years, the demographic groups most similar to Hmong are Immigrants from West Indies ($88,164, a difference of 0.050%), Jamaican ($88,327, a difference of 0.24%), Immigrants from Micronesia ($87,864, a difference of 0.29%), Osage ($88,390, a difference of 0.31%), and Spanish American ($87,836, a difference of 0.32%).
| Demographics | Rating | Rank | Householder Income Ages 45 - 64 years |
| Liberians | 0.3 /100 | #260 | Tragic $88,929 |
| Belizeans | 0.3 /100 | #261 | Tragic $88,684 |
| Somalis | 0.3 /100 | #262 | Tragic $88,600 |
| Immigrants | Senegal | 0.3 /100 | #263 | Tragic $88,421 |
| Osage | 0.3 /100 | #264 | Tragic $88,390 |
| Jamaicans | 0.2 /100 | #265 | Tragic $88,327 |
| Immigrants | West Indies | 0.2 /100 | #266 | Tragic $88,164 |
| Hmong | 0.2 /100 | #267 | Tragic $88,115 |
| Immigrants | Micronesia | 0.2 /100 | #268 | Tragic $87,864 |
| Spanish Americans | 0.2 /100 | #269 | Tragic $87,836 |
| Immigrants | Liberia | 0.2 /100 | #270 | Tragic $87,739 |
| Guatemalans | 0.2 /100 | #271 | Tragic $87,705 |
| Cape Verdeans | 0.2 /100 | #272 | Tragic $87,580 |
| Spanish American Indians | 0.2 /100 | #273 | Tragic $87,561 |
| Iroquois | 0.1 /100 | #274 | Tragic $87,255 |